5. Reports
Our Report feature is complementary to what Attestations can do. While an attestation locks a single experiment, Reports can lock many at a time, guaranteeing no further changes will be performed on them. In a sense, reports act like macro-attestations. They lock multiple experiments together. You can further add figures and tables to the report and export these assets (tables in CSV format and combined performance figures in either PDF, PNG or JPEG) and paste them into your final scientific paper.
Like Attestations, reports can be locked (i.e. the platform guarantees no further changes will be done on the report itself nor associated experiments) and should be published once the associated paper is accepted. Like for Attestations, locked reports can be accessed via a specific numbered URL which guarantees confidentiality while the report is not publicly available. You can use this feature to paste the numbered report URL on your paper, close to the figure or table exported from this report. This way, a reviewer can click on it and be brought back to a confirmation screen indicating your results. If associated experiments are not public yet, that is all the reviewer will be able to check (i.e., your figures and tables). As soon as you make your report public (after, for example, your paper was accepted for publication), associated experiments will also be made public and everybody will be able to access their details, pretty much like for Attestations. You’ll be able to set algorithm source-code visibility the same way as for Attestations.
5.1. Creating a report
Creating a report is very simple. You only need to go to the reports page and click on the “New” button. A dialog box will appear and will ask you to enter a valid report name (one that has not been used earlier). The platform will immediately generate a new empty report. The next step will be to add in some experiments to this report.
Note
Naming Convention
Reports are named using two values joined by a / (slash) operator:
username: indicates the author of the report
name: indicates the name of the report
Each tuple of these three components defines a unique report name inside the platform. For a grasp, you may browse publicly available reports.
Numbered URL
Warning
Like for Attestations, reports can also be accessed via a uniquely numbered URL. The numbered URL should be used in your scientific reports instead of the two-tiered name variant. Only this numbered URL is guaranteed to exist through platform updates.
5.1.1. Adding experiments to a report
The main function of a report is to display and compare results and configuration parameters from various experiments.
It is possible to add experiments to existing reports in a number of ways:
from the list of experiments
directly from the experiment page
from the list of experiments on a particular toolchain page
from the list of experiments on a particular algorithm page
from the results of a Search.
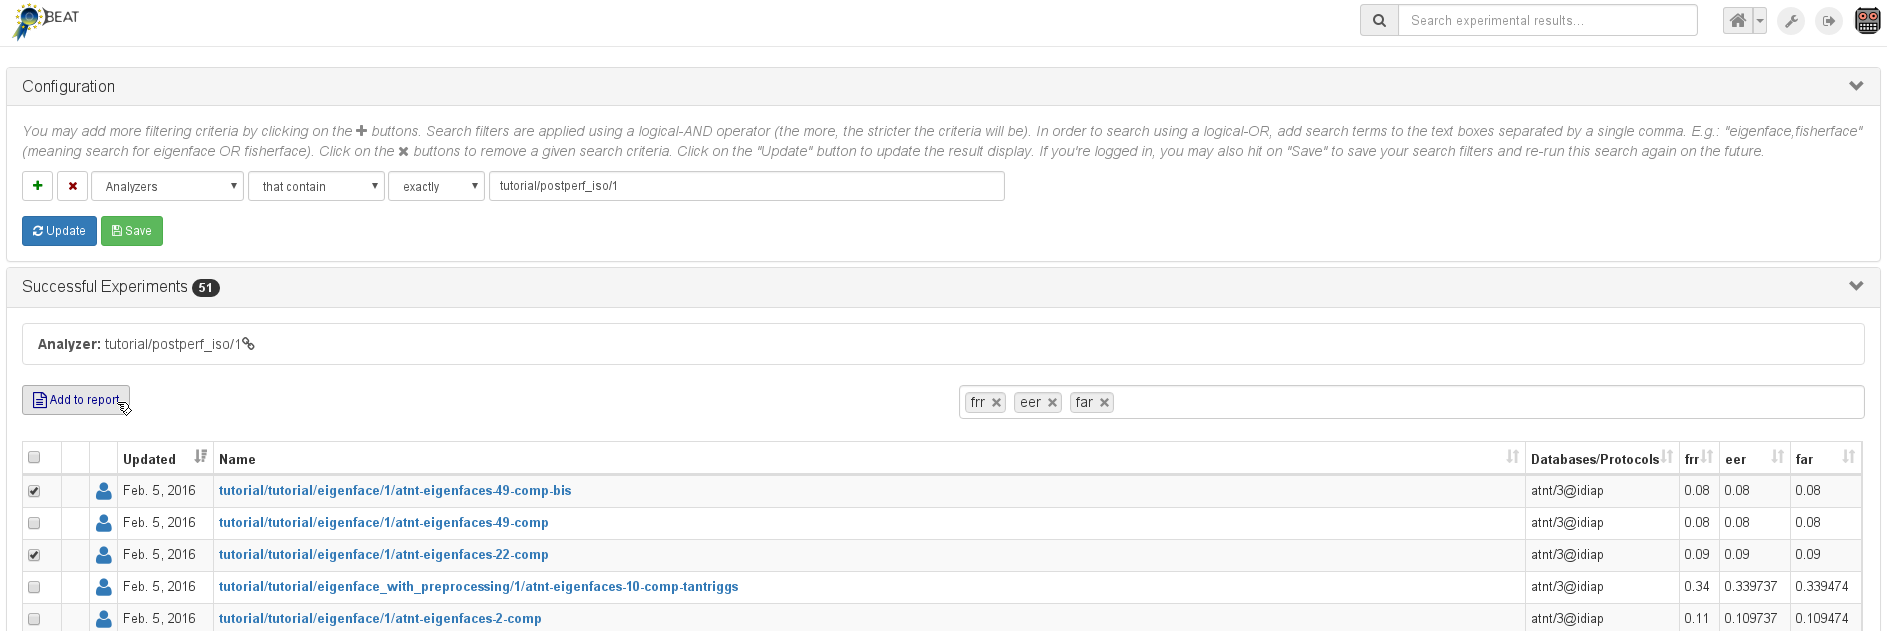
In order to add an experiment to a report, click on the check boxes to the left of the relevant experiment lists and then click on the button “Add to report”, situated on the top of this list. A pop-up will then appear asking you to select the report in which to place the new experiment(s). Select the report and then confirm using the button “Add”. Another pop-up will appear indicating how many experiments, out of the selected ones, were successfuly added to the report.
You may also a list of experiments through the search tab when. (Note that you can add experiments to your report from a search list too).
Note
The platform currently does not report on experiments that could not be added to the existing report.
If an experiment was already added to a report, re-adding it does not duplicate the experiment on the report.
5.1.2. Creating & Managing Report Groups
Once you have experiments in a report, you must create at least one report group. Each group holds a subset of the report’s experiments and compares the experiments’ results. In these groups you may add figures and tables, as well as blocks of text.
Important
In order to properly compare experiments, the single requirement built into the platform is that each experiment in a group uses the same analysis algorithm (i.e., the algorithm that is placed on the last block of a toolchain).
This is checked by the platform when you try to add an experiment to a group that does not match this criteria. If the group has no experiments, you may add any experiment.
5.1.3. Report states
A report could be in one of these three states:
Editable: This state allows you to work on your report and set it up for your publication. All reports are created in this state. Here is what you can do when a report is Editable:
You can add documentation. Use this feature as a caption to your figure and tables, explaining the reader what is displayed.
You can remove experiments from the report
You can set-up aliases to experiments in each report group that it belongs. Very often, when one publishes content from experiments executed, it is nice to be able to reset experiment names so as to identify specific use conditions. The platform allows this through the aliasing feature. You can setup an experiment alias, for example, to say “our system”, distinguishing your contribution from the other experiments in the report group (and, thusly, in the group’s figures and tables).
You can add, delete, rename, and reorganize report groups and their items (i.e. tables, figures, and text blocks)
The floating point precision could be set to fix the precision of floating point outputs in your tables
The specific plotter configuration may be changed for plots, if there are multiple valid configurations available.
Locked: This state is intended for review purposes. Once flipped, reviewers have the guarantee that your results are validated by the platform. No modification is further possible once you decide to lock the report. Notice that, following our privacy-by-design policy, private experiments cannot be inspected by any potential reviewer with this URL. Only the results can be seen when the report is Locked. Experiment aliases are shown instead of the final experiment names everywhere.
A Locked report can be still deleted, in which case its public (numbered) URL is lost forever.
Published: When the paper mentioning the report has been accepted and published, you can set your report public and make it available to any platform or anonymous user. At this stage, all experimental results will be made public. You can still select which algorithms will be only executable (no source-code visibility) or be open-sourced.
On each of these states, the report could be accessed for the user via the user report link (example: url/reports/user/report-name) or via a unique report id url generated by the platform (url/reports/123456789) for external people.
When working on your report with others or when submitting for review or for publication, you should always give the unique report id.
5.1.4. Working with other co-authors, reviewers and publishing your report
You are able to work with other parties, or show your report to a reviewer or for publication purpose by using the unique (numbered) report URL of your report.
The unique URL is guaranteed not to change even when the state (editable, locked, published) of your report has changed.
To be able to share your report url with a reviewer, it is important you change the report status from Editable to Locked via the action buttons at the top of your report. However, if you have made modifications, be sure you have click on the Save button first.
Once you’re ready for publication, make sure you have set your report status form Locked to Published. This will make all your private experiments public and your report will be available to the world via the unique report id URL.
5.1.5. Adding tables and plots
Adding tables, charts, and text blocks can be easily done with the help of the Add Plot, Add Table, and Add Text Block buttons in the header of each group in the report. The group must have at least 1 experiment in it to add report items.
You will be able to select the type of figure (for a plot) or the information you wish to compare (for a table), among the group’s experiments.
5.1.6. Exporting a figure
Any figure from your report can be exported to PNG, JPEG or PDF format using the corresponding “Download” button from the figure panel.
5.1.7. Exporting a table
Any table from your report can be shown as copy-friendly CSV text by using the “Toggle CSV” button from the table panel.
5.1.8. Export a text block
You can see the source (ReStructured Text format) of any text block by using the “Toggle Source View” button from the text block panel.
5.1.9. Comparing results
5.1.9.1. Comparing Plot Results
Depending on the type of plot, the user is able to select the “plotter” and “plotter parameter” as they wish.
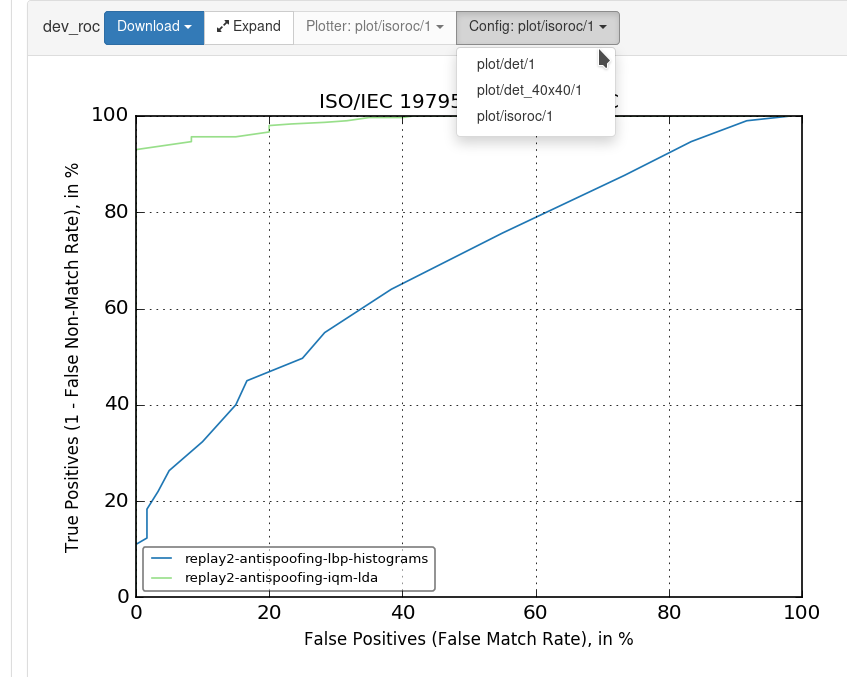
If the graphic is cluttered by too much information or if you wish to plot each experiment independently, you can easily click on the “Expand” button on the specific plot panel to display multiple plots.
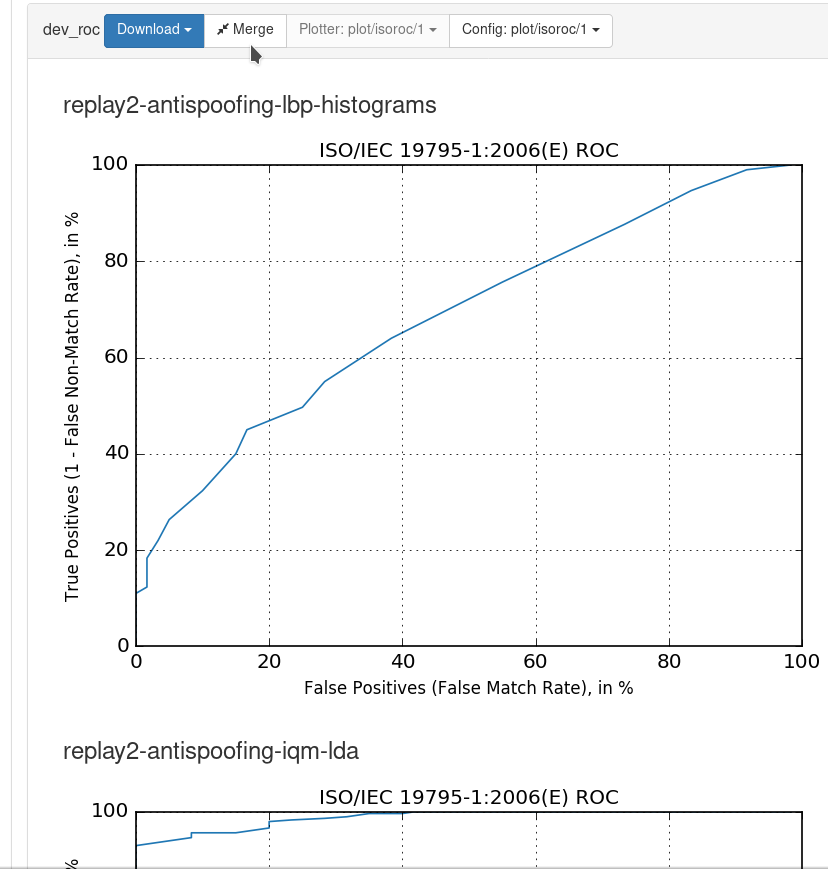
Use the “Merge” button to combine expanded plots back into one.
5.1.9.2. Comparing Table Results
It is possible to compare a large panel of items on a table, including:
results from the experiments
execution time information for each experiment
execution time information for similar blocks from each experiment
parameters from various corresponding algorithms on each experiments
You can display the column selector by clicking the “Choose Columns” button in a table panel.
5.2. Saving your Report
The BEAT platform allows you to save your reports. This feature includes all the report items defined in your report including the configuration options and table/figure parameters. To save your report, you must be logged in with your user account. The report must be in Editable mode if you wish to make any sort of modification to it.
All saved reports can be re-displayed through your Reports tab.
Warning
If you did not click on Save after doing a modification, you will lose all your modifications!
In other words, always click on Save before you quit the report page.
5.3. Changing the Report documentation
In order to add or change the documentation associated to a report, click on
the button add from the documentation panel, situated under the report
title, at the report view page. The box shown below will be displayed:
You may fill in a short description, that will be displayed at the report list
page and a longer one, in restructured text format. Use the editor and the
links displayed to retrieve more information. Click on the Save button to
save your documentation or the Cancel button to cancel the add/change
operation. You may change the documentation of objects at the BEAT plaform
at any time.
5.4. Deleting a Report
You may delete a report at any time (while it’s still in an editable
mode)through the search listing page or on the report itself. Just click on the
button Delete to delete the stored report. Once deleted, the report cannot
be restored. Its unique URL is lost.
5.5. Example Workflow
To tie together the above documentation, the following is an example workflow for creating and editing a report:
To begin, create a report on the reports list page (as described above).
Add experiments to the report, either by browsing & selecting experiments through the experiments list page or adding individual experiments from their pages.
Back in your report, add a description for the report.
Create your report groups for comparing different experiments. For example, creating “Performance on Database 1” (Group 1), “Performance on Database 2” (Group 2), and “Overall Performance” (Group 3) groups for comparing experiments that were ran using Database 1, experiments using Database 2, and all experiments.
Add experiments to your report groups (remember, experiments must have the same analyzer to be comparable!). Continuing with the above example, we assume all the experiments in the report have the same analyzer. We add any experiments using Database 1 to Group 1, any experiments using Database 2, and all experiments to Group 3.
In each group, change your experiments’ aliases (each group has its own list of aliases).
In each group, add & adjust your report items. You can use text blocks to explain plots and tables or describe groups.
Now, click on the link to the numbered version of your report to see it as others will see it. Remember, to see changes from edit-mode, you must save your changes!
Continue to change your report, occasionally checking the numbered version to make sure others will see what you want. Remember, you can reorder items inside of a group and groups inside of report as well as renaming groups & items.
Eventually, you will want to lock your report, and then publish it.