3. Experiments
The main purpose of the BEAT platform is to allow researchers to construct
Experiments. An Experiment is a specific combination of a dataset, a
Toolchain, and a set of relevant, and appropriately parameterised, Algorithms.
Executing an Experiment produces a set of numerical and graphical results.
Each experiment uses different resources available on the BEAT platform such as different databases and algorithms. Each experiment has its own Toolchains which cannot be changed after the experiment is created. Experiments can be shared and forked, to ensure maximum re-usability.
3.1. Displaying an existing experiment
To see the list of existing Experiments, click the User Resources tab in
your home page and select Experiments from the drop-down menu. You will see
a webpage similar to the following image:
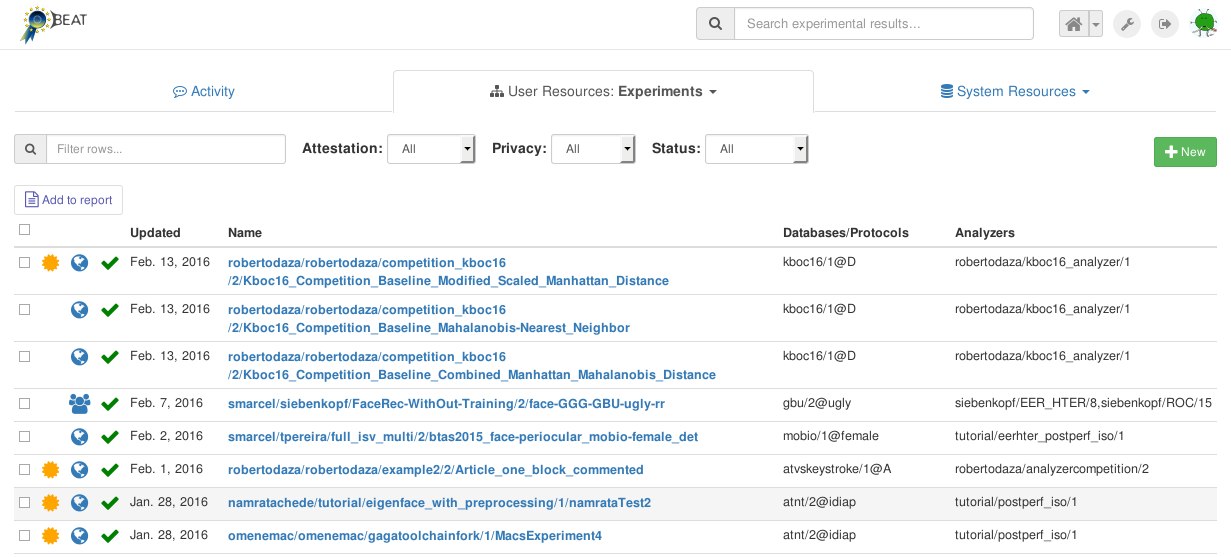
You can use the various filters (Attestation, Privacy and Status)
as well as the free-text Search-box to narrow down your search. For each
Experiment shown in the list, additional information is also displayed.
This includes:
a gold medal: indicating whether an attestation has already been generated for this experiment,
a green tick: indicating that the last execution of the
Experimentwas successful,the database used in this
Experiment, and,the analyzers used in this
Experiment.
Clicking on any Experiment, leads to a new page, displaying its
configuration and results:

This page consists of several Tabs: Results, Execution Details,
Documentation, and Referers. Of these, the first two tabs are the most
useful. By default, the Results tab is open, showing the results of the
Experiment.
The contents of the Results tab depends on the configuration of the
Analyzer in the Toolchain. Typically, numerical values, such as various
kinds of error-rates, as well as graphical elements, such as ROC curves for
different data-sets, are displayed in this tab.
On the Execution Details tab , a graphical representation of the
Toolchain is displayed. This tab also displays the parameters selected for
each block in the Toolchain, as well as information about the execution of each
block (queuing time and execution time).
Icons for several actions are provided in the top-right region of the
Experiment page. The list of icons should be similar to that shown in the
image below:
These icons represent the following options (from left to right):
green arrow: share the (currently private) experiment with other users
red cross: delete the experiment
blue tag: rename the experiment
gold medal: request attestation
circular arrow: reset the experiment (if some of the blocks in the experiment have been ran before the platform will use the cache available for the outputs of those blocks)
fork: fork a new, editable copy of this experimentpage: add experiment to report
blue lens: search for similar experiments
(Placing the mouse of an icon will also display a tool-tip indicating the
function of the icon.) The exact list of options provided will depend on what
kind of experiment you are looking at. For example, the gold medal will
appear on the page only if you are permitted to request attestation for this
particular experiment (i.e., if you are the owner of this experiment and it
executed sucessfully).
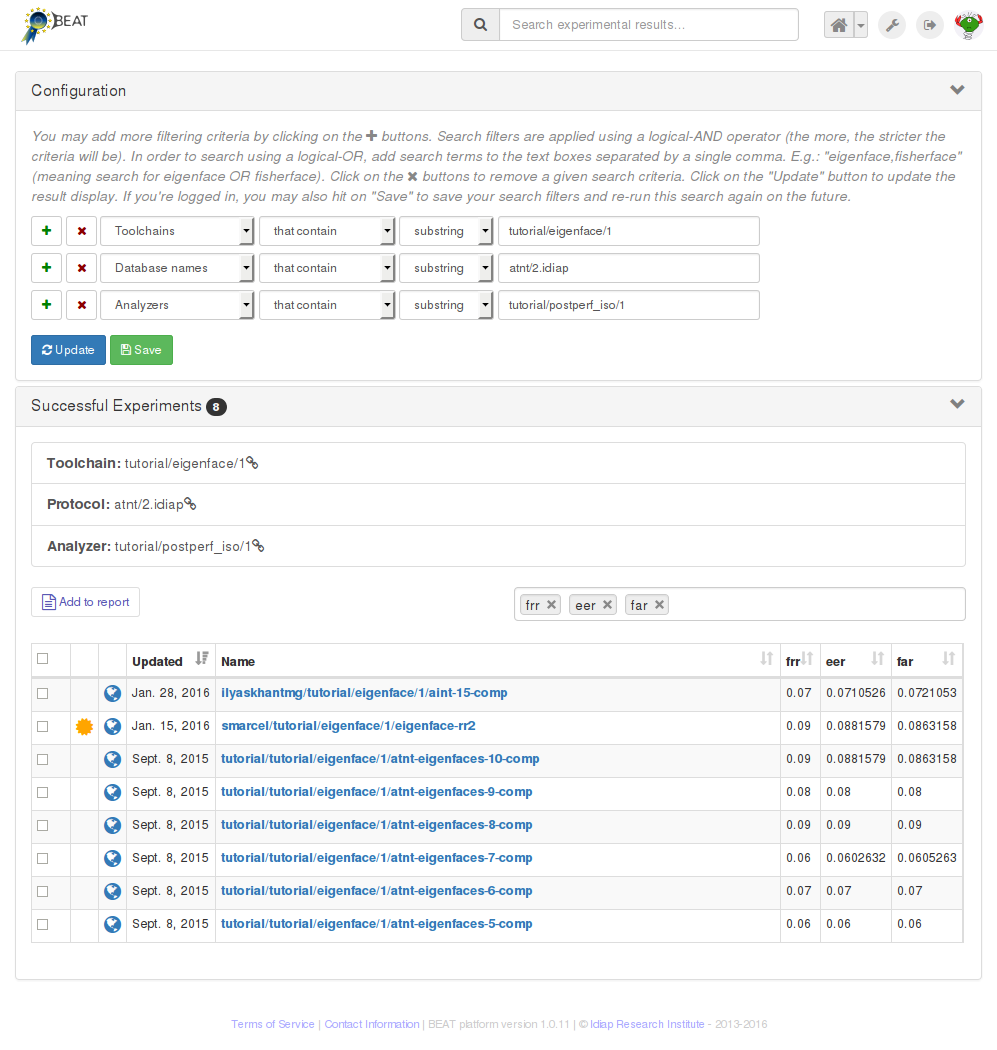
The button Similar experiments opens a new tab where experiments using the
same toolchain, analyzer or database are shown:
3.2. Creating a new experiment
On the main Experiments page, new experiments can be created by clicking on the
New button. You will immediately be prompted to select a Toolchain for
your new experiment. Once you have specified a toolchain, a page similar to
that in the image below will be displayed:
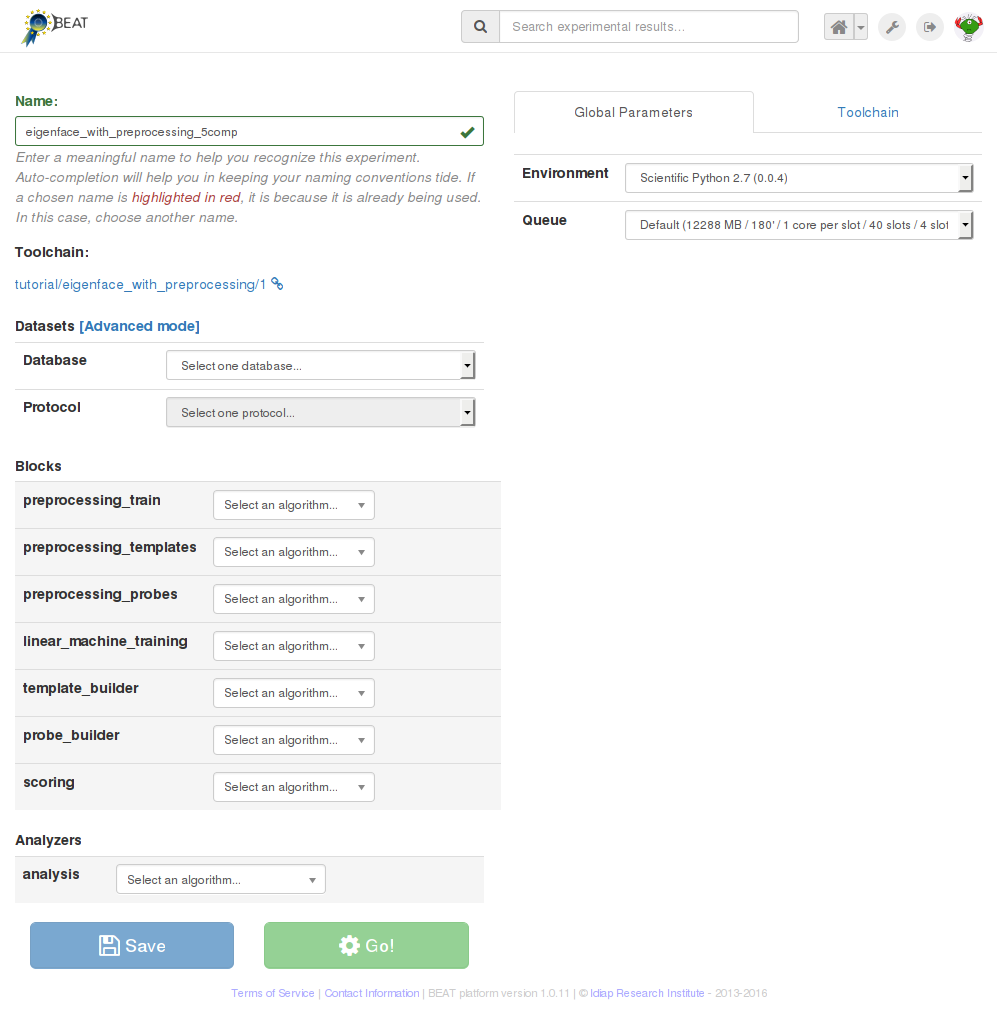
The next step in constructing a new experiment is to defined an experiment name and, finally, configure the contents of each and every block of the selected toolchain:
Datasets: choose the database, from among the existing databases fulfilling the toolchain requirements, and then choose the protocol among the ones available in the database. In this “simplified” configuration mode, the platform chooses the contents of the input dataset blocks based on preset configurations for particular databases and protocols. Use this configuration mode for making sure you respect protocol usage for a given database.
You may optionally click on
Advancedto turn-on advanced dataset selection mode, in which you can hand-pick the datasets to be used in each dataset block. In this mode, you’re responsible for selecting the appropriate dataset for each relevant block of your toolchain. You can mix and match as you like. For example, train using a particular dataset, test using another one.You may reset back to “simplified” selection mode by clicking on
Reset.Blocks: assign one algorithm to each block, such as image pre-processing, classifier or similarity score function. If similar blocks exist on the toolchain, selecting an algorithm for a block will make the platform suggest the same algorithm for similar blocks. This mechanism is in place to ease algorithm selection and avoid common mistakes. You may override platform suggestions (marked in orange) at any moment by removing the automatically assigned algorithm and choosing another one from the list.
The user should make sure that the correct algorithm is selected for each block. Configurable parameters, if provided by the selected algorithms, are dynamically added to the
Global Parameterspanel, to the right of the screen.Use that panel to setup global values which are effective for all instances of the same algorithm on the experiment. You may, optionally, override global values locally, by clicking on the algorithm’s arrow down icon and selecting which values, from the global parameters, to override for that particular block.
Among local override options, you’ll also find a handle to change the environment, queue or the used number of slots (if the algorithm is splittable) on a per-block basis. Use these options to allow the algorithm on a specific block to run on a special queue (e.g., that makes available more memory), a special environment (e.g., with a different backend that contains a specific library version you need) or with more slots.
Analyzer: algorithm used to evaluate the performance and generate results. Options for this block are similar for normal blocks.
Note
As mentioned in the “Experiments” section of “Getting Started with BEAT” in BEAT documentation, BEAT checks that connected datasets, algorithms and analyzers produce or consume data in the right format. It only presents options which are compatible with adjacent blocks.
Tip: If you reach a situation where no algorithms are available for a given block, reset the experiment and try again, making sure the algorithms you’d like to pick have compatible inputs and outputs respecting the adjacent blocks.
Note
Queues and Environments
For a better understanding of queues and environments, please consult our dedicated Queues and Environments section.
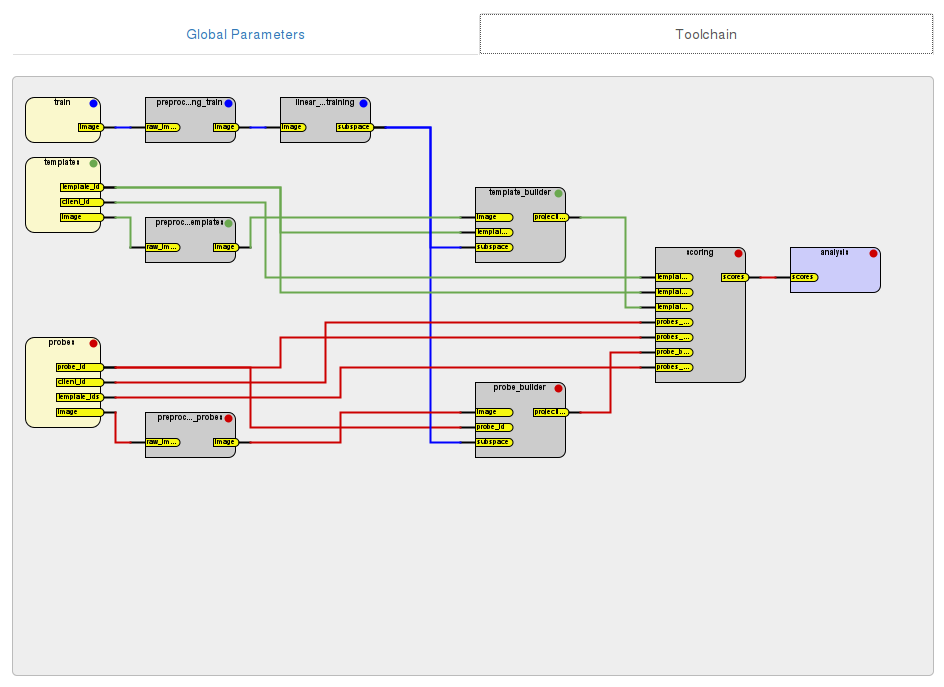
The complete toolchain for the Experiment can be viewed on the
Toolchain tab (expanded view shown below):
After an Experiment has been set up completely, you can save the the
experiment in the BEAT platform via the blue Save button or execute
it immediately by clicking the green Go! button.