Presentation Attack Detection In Practice
In this package, PAD experiments are organized around the same concepts that
were introduced in Samples, a way to enhance scikit pipelines with metadata. To easily run experiments in
PAD, we offer a generic command called: bob pad run-pipeline.
The following will introduce how a simple experiment can be run with this tool, from the sample data to a set of metrics and plots, as defined in Introduction to Presentation Attack Detection.
Running a PAD experiment
A PAD experiment consists of taking a set of biometric bonafide and presentation attack samples, feeding them to a pipeline, to finally gather the corresponding set of scores for analysis.
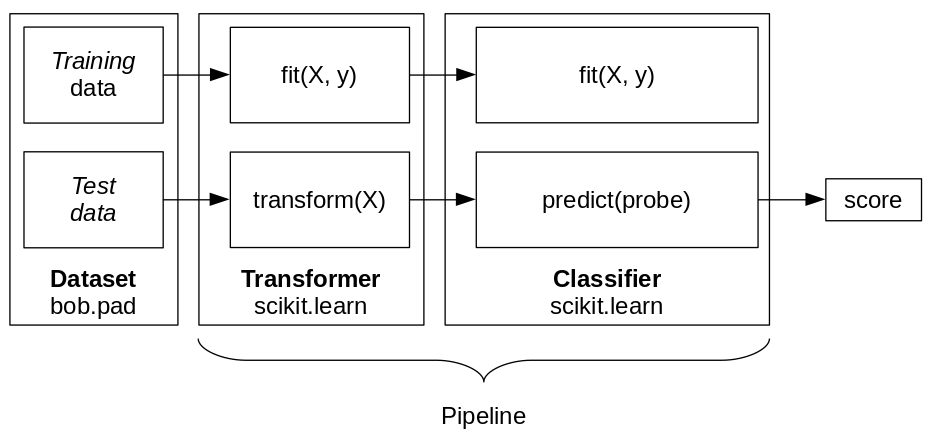
Fig. 20 The pipeline of Transformer(s) and Classifier can be trained (fit) or used to generate a score for each input sample.
The run-pipeline command needs a pipeline and a database object to run.
These variables can be provided inside configuration files:
$ bob pad run-pipeline [OPTIONS] CONFIG-1 CONFIG-2 ...
The different available options can be listed by giving the --help flag to the command:
$ bob pad run-pipeline --help
and an example config file can be generated with:
$ bob pad run-pipeline --dump-config example_config.py
Note
The list of existing pipelines and databases resources can also be found in
the output of both bob pad run-pipeine --help and bob pad run-pipeline
--dump-config.
Building your own PAD pipeline
The PAD pipeline is the backbone of any experiment in this library. It is composed of:
Transformers (optional): One or multiple instances of
sklearn.base.BaseEstimatorandsklearn.base.TransformerMixin. A Transformer takes a sample as input applies a modification on it and outputs the resulting sample. A transformer can be trained before being used.A classifier: An instance of
sklearn.base.BaseEstimatorandsklearn.base.ClassifierMixinimplementing thefitandpredict_probordecision_functionmethods. A classifier takes a sample as input and returns a score. It is possible to train it beforehand with thefitmethod.
Transformers
A Transformer is a class that implements the fit and transform methods, which allow the application of an operation on a sample of data. For more details, see Transformer.
Here are two basic transformers one that does not require fit and one that does:
from sklearn.base import TransformerMixin, BaseEstimator

class TransformerWithoutFit(TransformerMixin, BaseEstimator):

   def fit(self, X, y):
      return self

   def transform(self, X):
      return modify_sample(X)

   def _more_tags(self):
      return {'requires_fit': False}

class TransformerWithFit(TransformerMixin, BaseEstimator):

   def fit(self, X, y):
      self.model = train_model(X, y)
      return self

   def transform(self, X):
      return modify_sample(X)

   def _more_tags(self):
      return {"bob_fit_extra_input": (("y", "is_bonafide"),)}
Classifier
A Classifier is the final process of a PAD pipeline. Its goal is to decide if a
transformed sample given as input is originating from a bonafide sample or a
presentation attack. The output is a score for each input sample. You need to
implement at least one of decision_function and predict_prob to use this
classifier.
Here is the minimal structure of a classifier:
from sklearn.base import TransformerMixin, BaseEstimator

class MyClassifier(ClassifierMixin, BaseEstimator):
   def __init__(self, **kwargs):
      super().__init__(**kwargs)
      self.state = 0

   def fit(self, X, y):
      self.state = update_state(self.state, X, y)

   def decision_function(self, X):
      # returns scores, a higher score means a more likely bona-fide sample
      return do_decision(X)

   def predict_proba(self, X):
      # returns probabilities of being a bonafide between 0 and 1
      return do_predict_proba(self.state, X)

   def _more_tags(self):
      return {"bob_fit_extra_input": (("y", "is_bonafide"),)}
Note
See bob.pipelines.get_bob_tags to learn about Bob specific tags that
can be used to change the default behavior of Bob Pipelines wrappers.
Note
The easiest method is to use a scikit-learn classifier, like
sklearn.svm.SVC. They are compatible with our pipelines, on the
condition to wrap them correctly (see below).
Running an experiment
Two parts of an experiment have to be executed:
Fit: labeled data is fed to the system to train the algorithm to recognize attacks and licit proprieties. This is optional, use the
requires_fittag to skip training.Predict: assessing a series of test samples for authenticity, generating a score for each one.
These steps are chained together in a pipeline object used by the bob pad
run-pipeline command. To build such a pipeline, the following configuration
file can be created:
from sklearn.pipeline import Pipeline
import bob.pipelines as mario

my_transformer = MyTransformer()

my_classifier = MyClassifier()

pipeline = Pipeline(
   [
      ("my_transformer", my_transformer),
      ("classifier", my_classifier),
   ]
)
pipeline = mario.wrap(["sample"], pipeline)
The pipeline can then be executed with the command:
$ bob pad run-pipeline my_config.py --output output_dir
When executed with run-pipeline, every training sample will pass through the
pipeline, executing the fit methods. Then, every sample of the dev set
(and/or the eval set) will be given to the transform method of
my_transformer and the result is passed to the decision_function method
of my_classifier. The output of the classifier (scores) is written to a
file.
Note
By default, run-pipeline expects the classifier to have a
decision_function method to call for the prediction step. It can be changed
with the -f switch to the prediction method of your classifier, for
instance -f predict_proba to use this method of your scikit-learn
classifiers. See sklearn-dev-docs for more details.
Using scikit-learn estimators
To use an existing scikit-learn Transformer or Classifier, they need to be
wrapped with a SampleWrapper (using Convenience wrapper function) to handle our
Samples, a way to enhance scikit pipelines with metadata objects:
import bob.pipelines as mario
from sklearn.pipeline import Pipeline
from sklearn.svm import SVC

my_transformer = MyTransformer()
wrapped_transformer = mario.wrap(["sample"], my_transformer)

sklearn_classifier = SVC()
wrapped_classifier = mario.wrap(
   ["sample"], sklearn_classifier, fit_extra_arguments=[("y", "is_bonafide")],
)

pipeline = Pipeline(
   [
      ("my_transformer", wrapped_transformer),
      ("classifier", wrapped_classifier),
   ]
)
Scores
Executing the pad pipeline results in a list of scores, one for each input
sample compared against each registered model. The scores are written in CSV
files in the specified output directory (pointed to run-pipeline with the
--output option), containing metadata in additional columns.
The scores represent the performance of a system on that data, but are not easily interpreted “as is”, so evaluation scripts are available to analyze them and show different aspects of the system performance.
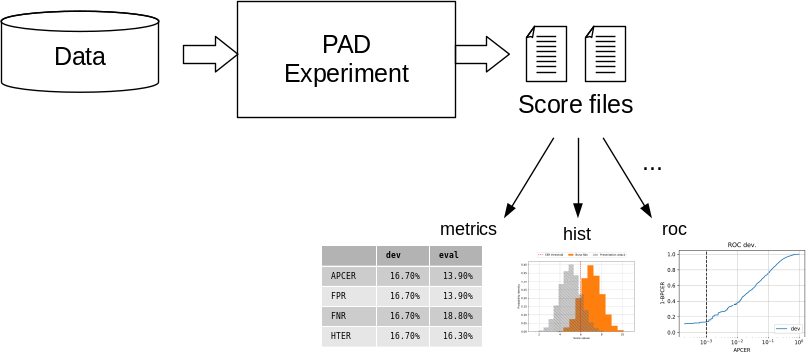
Fig. 21 The PAD pipeline generates score files that can be used with various scripts to evaluate the system performance by computing metrics or drawing plots.
Evaluation
Once the scores are generated for each class and group, the evaluation tools can be used to assess the performance of the system, by either drawing plots or computing metrics values at specific operation points.
Generally, the operation thresholds are computed on a specific set (development set or dev). Then those threshold values are used to compute the system error rates on a separate set (evaluation set or eval).
To retrieve the most common metrics values for a spoofing scenario experiment, run the following command:
$ bob pad metrics --eval scores-{dev,eval}.csv --legends ExpA

Threshold of 11.639561 selected with the bpcer20 criteria
======  ========================  ===================
ExpA    Development scores-dev    Eval. scores-eval
======  ========================  ===================
APCER   5.0%                      5.0%
BPCER   100.0%                    100.0%
ACER    52.5%                     52.5%
======  ========================  ===================

Threshold of 3.969103 selected with the eer criteria
======  ========================  ===================
ExpA    Development scores-dev    Eval. scores-eval
======  ========================  ===================
APCER   100.0%                    100.0%
BPCER   100.0%                    100.0%
ACER    100.0%                    100.0%
======  ========================  ===================

Threshold of -0.870550 selected with the min-hter criteria
======  ========================  ===================
ExpA    Development scores-dev    Eval. scores-eval
======  ========================  ===================
APCER   100.0%                    100.0%
BPCER   19.5%                     19.5%
ACER    59.7%                     59.7%
======  ========================  ===================
Note
When evaluation scores are provided, the -e option (--eval) must be passed.
See metrics –help for further options.
Plots
Customizable plotting commands are available in the bob.pad.base module.
They take a list of development and/or evaluation files and generate a single PDF
file containing the plots.
Available plots for a spoofing scenario (command bob pad) are:
hist(Bonafide and PA histograms along with threshold criterion)epc(expected performance curve)gen(Generate random scores)roc(receiver operating characteristic)det(detection error trade-off)evaluate(Summarize all the above commands in one call)
Use the --help option on the above-cited commands to find-out about more
options.
For example, to generate an EPC curve from development and evaluation datasets:
$ bob pad epc --output my_epc.pdf scores-{dev,eval}.csv
where my_epc.pdf will contain EPC curves for all the experiments.