From Face Recognition to Heterogeneous Face Recognition
This section contains instructions on how to reproduce the experiments from Chapter 3 From Face Recognition to Heterogeneous Face Recognition.
CUHK-CUFS Experiments
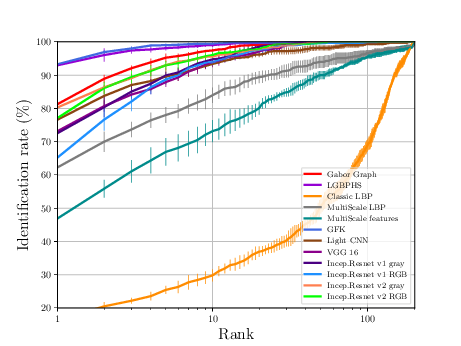
The sequence of experiments in this subsection generates the necessary data to generate Figure 3.4 and Table 3.3.
First, the experiments should be generated:
$ bob bio htface htface_baseline gabor_graph cuhk-cufs -vv
$ bob bio htface htface_baseline lgbphs cuhk-cufs -vv
$ bob bio htface htface_baseline htface_classic_lbp cuhk-cufs -vv
$ bob bio htface htface_baseline htface_lightcnn cuhk-cufs -vv
$ bob bio htface htface_baseline htface_vgg16 cuhk-cufs -vv
$ bob bio htface htface_baseline htface_idiap_msceleb_inception_v1_centerloss_gray cuhk-cufs -vv
$ bob bio htface htface_baseline htface_idiap_msceleb_inception_v1_centerloss_rgb cuhk-cufs -vv
$ bob bio htface htface_baseline htface_idiap_msceleb_inception_v2_centerloss_gray cuhk-cufs -vv
$ bob bio htface htface_baseline htface_idiap_msceleb_inception_v2_centerloss_rgb cuhk-cufs -vv
$ bob bio htface htface_baseline htface_mlbphs cuhk-cufs -vv
$ bob bio htface htface_baseline htface_multiscale_features cuhk-cufs -vv
$ bob bio htface htface_baseline htface_classic_lbp cuhk-cufs -vv
Note
If you are at IDIAP, it is possible to trigger these experiements by setting –grid grid option. For more info check:
$ bob bio htface htface_baseline --help
Once the experiments are executed, the plots and metrics can be generated with the following command:
$ bob bio htface evaluate_and_squash \
 \
  <experiment_path>/cuhk-cufs/gabor_graph/ \
  <experiment_path>/cuhk-cufs/lgbphs/ \
  <experiment_path>/cuhk-cufs/htface_classic_lbp/ \
  <experiment_path>/cuhk-cufs/htface_mlbphs/ \
  <experiment_path>/cuhk-cufs/htface_multiscale_features/ \
  <experiment_path>/cuhk-cufs/htface_gfkgabor/ \
  <experiment_path>/cuhk-cufs/htface_lightcnn/ \
  <experiment_path>/cuhk-cufs/htface_vgg16/ \
  <experiment_path>/cuhk-cufs/htface_idiap_msceleb_inception_v1_centerloss_gray/ \
  <experiment_path>/cuhk-cufs/htface_idiap_msceleb_inception_v1_centerloss_rgb/ \
  <experiment_path>/cuhk-cufs/htface_idiap_msceleb_inception_v2_centerloss_gray/ \
  <experiment_path>/cuhk-cufs/htface_idiap_msceleb_inception_v2_centerloss_rgb/ \
  \
  --legends "Gabor Graph" --legends "LGBPHS" --legends "Classic LBP" \
  --legends "MultiScale LBP" --legends "MultiScale features" --legends "GFK" \
  --legends "Light CNN" --legends "VGG 16" \
  --legends "Incep.Resnet v1 gray" --legends "Incep.Resnet v1 RGB" \
  --legends "Incep.Resnet v2 gray" --legends "Incep.Resnet v2 RGB" \
  --report-name "cufs.pdf" \
  --x-min 20 \
Note
It’s not necessary to run everything at once. Generate partial plots is a possibility. For more info check:
$ bob bio htface evaluate_and_squash --help
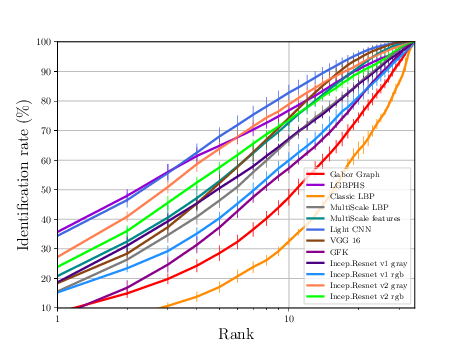
If everything goes alright the following plot should be dumped
CUHK-CUFSF Experiments
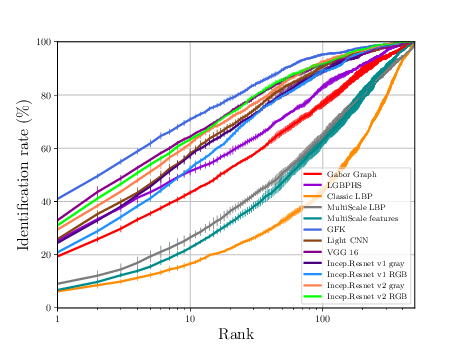
The sequence of experiments in this subsection generates the necessary data to generate Figure 3.4 and Table 3.3.
First, the experiments should be generated:
$ bob bio htface htface_baseline gabor_graph cuhk-cufsf -vv
$ bob bio htface htface_baseline lgbphs cuhk-cufsf -vv
$ bob bio htface htface_baseline htface_classic_lbp cuhk-cufsf -vv
$ bob bio htface htface_baseline htface_lightcnn cuhk-cufsf -vv
$ bob bio htface htface_baseline htface_vgg16 cuhk-cufsf -vv
$ bob bio htface htface_baseline htface_idiap_msceleb_inception_v1_centerloss_gray cuhk-cufsf -vv
$ bob bio htface htface_baseline htface_idiap_msceleb_inception_v1_centerloss_rgb cuhk-cufsf -vv
$ bob bio htface htface_baseline htface_idiap_msceleb_inception_v2_centerloss_gray cuhk-cufsf -vv
$ bob bio htface htface_baseline htface_idiap_msceleb_inception_v2_centerloss_rgb cuhk-cufsf -vv
$ bob bio htface htface_baseline htface_mlbphs cuhk-cufsf -vv
$ bob bio htface htface_baseline htface_multiscale_features cuhk-cufsf -vv
$ bob bio htface htface_baseline htface_classic_lbp cuhk-cufsf -vv
Note
If you are at IDIAP, it is possible to trigger these experiements by setting –grid grid option. For more info check:
$ bob bio htface htface_baseline --help
Once the experiments are executed, the plots and metrics can be generated with the following command:
$ bob bio htface evaluate_and_squash \
 \
  <experiment_path>/cuhk-cufsf/gabor_graph/ \
  <experiment_path>/cuhk-cufsf/lgbphs/ \
  <experiment_path>/cuhk-cufsf/htface_classic_lbp/ \
  <experiment_path>/cuhk-cufsf/htface_mlbphs/ \
  <experiment_path>/cuhk-cufsf/htface_multiscale_features/ \
  <experiment_path>/cuhk-cufsf/htface_gfkgabor/ \
  <experiment_path>/cuhk-cufsf/htface_lightcnn/ \
  <experiment_path>/cuhk-cufsf/htface_vgg16/ \
  <experiment_path>/cuhk-cufsf/htface_idiap_msceleb_inception_v1_centerloss_gray/ \
  <experiment_path>/cuhk-cufsf/htface_idiap_msceleb_inception_v1_centerloss_rgb/ \
  <experiment_path>/cuhk-cufsf/htface_idiap_msceleb_inception_v2_centerloss_gray/ \
  <experiment_path>/cuhk-cufsf/htface_idiap_msceleb_inception_v2_centerloss_rgb/ \
  \
  --legends "Gabor Graph" --legends "LGBPHS" --legends "Classic LBP" \
  --legends "MultiScale LBP" --legends "MultiScale features" --legends "GFK" \
  --legends "Light CNN" --legends "VGG 16" \
  --legends "Incep.Resnet v1 gray" --legends "Incep.Resnet v1 RGB" \
  --legends "Incep.Resnet v2 gray" --legends "Incep.Resnet v2 RGB" \
  --report-name "cufsf.pdf" \
  --x-min 20 \
Note
It’s not necessary to run everything at once. Generate partial plots is a possibility. For more info check:
$ bob bio htface evaluate_and_squash --help
If everything goes alright the following plot should be dumped
CASIA Experiments
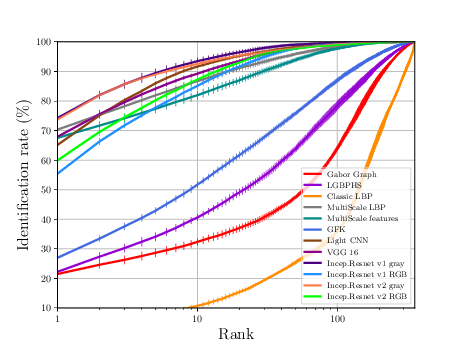
The sequence of experiments in this subsection generates the necessary data to generate Figure 3.7 (a) and Table 3.4.
First, the experiments should be generated:
$ bob bio htface htface_baseline gabor_graph casia-nir-vis-2 -vv
$ bob bio htface htface_baseline lgbphs casia-nir-vis-2 -vv
$ bob bio htface htface_baseline htface_classic_lbp casia-nir-vis-2 -vv
$ bob bio htface htface_baseline htface_lightcnn casia-nir-vis-2 -vv
$ bob bio htface htface_baseline htface_vgg16 casia-nir-vis-2 -vv
$ bob bio htface htface_baseline htface_idiap_msceleb_inception_v1_centerloss_gray casia-nir-vis-2 -vv
$ bob bio htface htface_baseline htface_idiap_msceleb_inception_v1_centerloss_rgb casia-nir-vis-2 -vv
$ bob bio htface htface_baseline htface_idiap_msceleb_inception_v2_centerloss_gray casia-nir-vis-2 -vv
$ bob bio htface htface_baseline htface_idiap_msceleb_inception_v2_centerloss_rgb casia-nir-vis-2 -vv
$ bob bio htface htface_baseline htface_mlbphs casia-nir-vis-2 -vv
$ bob bio htface htface_baseline htface_multiscale_features casia-nir-vis-2 -vv
$ bob bio htface htface_baseline htface_classic_lbp casia-nir-vis-2 -vv
Note
If you are at IDIAP, it is possible to trigger these experiements by setting –grid grid option. For more info check:
$ bob bio htface htface_baseline --help
Once the experiments are executed, the plots and metrics can be generated with the following command:
$ bob bio htface evaluate_and_squash \
 \
  <experiment_path>/casia-nir-vis-2/gabor_graph/ \
  <experiment_path>/casia-nir-vis-2/lgbphs/ \
  <experiment_path>/casia-nir-vis-2/htface_classic_lbp/ \
  <experiment_path>/casia-nir-vis-2/htface_mlbphs/ \
  <experiment_path>/casia-nir-vis-2/htface_multiscale_features/ \
  <experiment_path>/casia-nir-vis-2/htface_gfkgabor/ \
  <experiment_path>/casia-nir-vis-2/htface_lightcnn/ \
  <experiment_path>/casia-nir-vis-2/htface_vgg16/ \
  <experiment_path>/casia-nir-vis-2/htface_idiap_msceleb_inception_v1_centerloss_gray/ \
  <experiment_path>/casia-nir-vis-2/htface_idiap_msceleb_inception_v1_centerloss_rgb/ \
  <experiment_path>/casia-nir-vis-2/htface_idiap_msceleb_inception_v2_centerloss_gray/ \
  <experiment_path>/casia-nir-vis-2/htface_idiap_msceleb_inception_v2_centerloss_rgb/ \
  \
  --legends "Gabor Graph" --legends "LGBPHS" --legends "Classic LBP" \
  --legends "MultiScale LBP" --legends "MultiScale features" --legends "GFK" \
  --legends "Light CNN" --legends "VGG 16" \
  --legends "Incep.Resnet v1 gray" --legends "Incep.Resnet v1 RGB" \
  --legends "Incep.Resnet v2 gray" --legends "Incep.Resnet v2 RGB" \
  --report-name "casia-nir-vis-2.pdf" \
  --x-min 20 \
Note
It’s not necessary to run everything at once. Generate partial plots is a possibility. For more info check:
$ bob bio htface evaluate_and_squash --help
If everything goes alright the following plot should be dumped
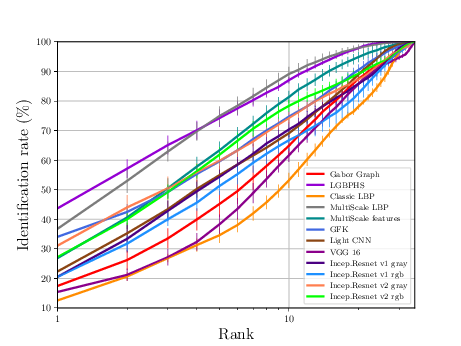
NIVL Experiments
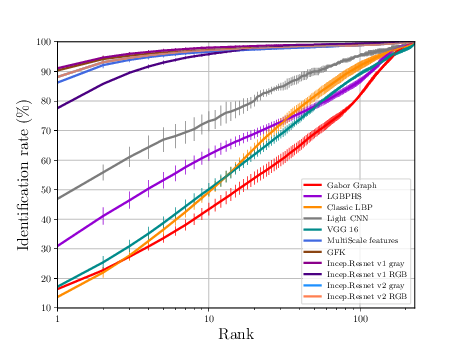
The sequence of experiments in this subsection generates the necessary data to generate Figure 3.7 (b) and Table 3.4.
First, the experiments should be generated:
$ bob bio htface htface_baseline gabor_graph nivl -vv
$ bob bio htface htface_baseline lgbphs nivl -vv
$ bob bio htface htface_baseline htface_classic_lbp nivl -vv
$ bob bio htface htface_baseline htface_lightcnn nivl -vv
$ bob bio htface htface_baseline htface_vgg16 nivl -vv
$ bob bio htface htface_baseline htface_idiap_msceleb_inception_v1_centerloss_gray nivl -vv
$ bob bio htface htface_baseline htface_idiap_msceleb_inception_v1_centerloss_rgb nivl -vv
$ bob bio htface htface_baseline htface_idiap_msceleb_inception_v2_centerloss_gray nivl -vv
$ bob bio htface htface_baseline htface_idiap_msceleb_inception_v2_centerloss_rgb nivl -vv
$ bob bio htface htface_baseline htface_mlbphs nivl -vv
$ bob bio htface htface_baseline htface_multiscale_features nivl -vv
$ bob bio htface htface_baseline htface_classic_lbp nivl -vv
Note
If you are at IDIAP, it is possible to trigger these experiements by setting –grid grid option. For more info check:
$ bob bio htface htface_baseline --help
Once the experiments are executed, the plots and metrics can be generated with the following command:
$ bob bio htface evaluate_and_squash \
 \
  <experiment_path>/nivl/gabor_graph/ \
  <experiment_path>/nivl/lgbphs/ \
  <experiment_path>/nivl/htface_classic_lbp/ \
  <experiment_path>/nivl/htface_mlbphs/ \
  <experiment_path>/nivl/htface_multiscale_features/ \
  <experiment_path>/nivl/htface_gfkgabor/ \
  <experiment_path>/nivl/htface_lightcnn/ \
  <experiment_path>/nivl/htface_vgg16/ \
  <experiment_path>/nivl/htface_idiap_msceleb_inception_v1_centerloss_gray/ \
  <experiment_path>/nivl/htface_idiap_msceleb_inception_v1_centerloss_rgb/ \
  <experiment_path>/nivl/htface_idiap_msceleb_inception_v2_centerloss_gray/ \
  <experiment_path>/nivl/htface_idiap_msceleb_inception_v2_centerloss_rgb/ \
  \
  --legends "Gabor Graph" --legends "LGBPHS" --legends "Classic LBP" \
  --legends "MultiScale LBP" --legends "MultiScale features" --legends "GFK" \
  --legends "Light CNN" --legends "VGG 16" \
  --legends "Incep.Resnet v1 gray" --legends "Incep.Resnet v1 RGB" \
  --legends "Incep.Resnet v2 gray" --legends "Incep.Resnet v2 RGB" \
  --report-name "casia-nir-vis-2.pdf" \
  --x-min 20 \
Note
It’s not necessary to run everything at once. Generate partial plots is a possibility. For more info check:
$ bob bio htface evaluate_and_squash --help
If everything goes alright the following plot should be dumped
LDHF Experiments
The sequence of experiments in this subsection generates the necessary data to generate Table 3.5.
First, the experiments should be generated:
$ bob bio htface htface_baseline gabor_graph ldhf -vv
$ bob bio htface htface_baseline lgbphs ldhf -vv
$ bob bio htface htface_baseline htface_classic_lbp ldhf -vv
$ bob bio htface htface_baseline htface_lightcnn ldhf -vv
$ bob bio htface htface_baseline htface_vgg16 ldhf -vv
$ bob bio htface htface_baseline htface_idiap_msceleb_inception_v1_centerloss_gray ldhf -vv
$ bob bio htface htface_baseline htface_idiap_msceleb_inception_v1_centerloss_rgb ldhf -vv
$ bob bio htface htface_baseline htface_idiap_msceleb_inception_v2_centerloss_gray ldhf -vv
$ bob bio htface htface_baseline htface_idiap_msceleb_inception_v2_centerloss_rgb ldhf -vv
$ bob bio htface htface_baseline htface_mlbphs ldhf -vv
$ bob bio htface htface_baseline htface_multiscale_features ldhf -vv
$ bob bio htface htface_baseline htface_classic_lbp ldhf -vv
Note
If you are at IDIAP, it is possible to trigger these experiements by setting –grid grid option. For more info check:
$ bob bio htface htface_baseline --help
Once the experiments are executed, the plots and metrics can be generated with the following command:
$ bob bio htface evaluate_and_squash \
 \
  <experiment_path>/ldhf/gabor_graph/ \
  <experiment_path>/ldhf/lgbphs/ \
  <experiment_path>/ldhf/htface_classic_lbp/ \
  <experiment_path>/ldhf/htface_mlbphs/ \
  <experiment_path>/ldhf/htface_multiscale_features/ \
  <experiment_path>/ldhf/htface_gfkgabor/ \
  <experiment_path>/ldhf/htface_lightcnn/ \
  <experiment_path>/ldhf/htface_vgg16/ \
  <experiment_path>/ldhf/htface_idiap_msceleb_inception_v1_centerloss_gray/ \
  <experiment_path>/ldhf/htface_idiap_msceleb_inception_v1_centerloss_rgb/ \
  <experiment_path>/ldhf/htface_idiap_msceleb_inception_v2_centerloss_gray/ \
  <experiment_path>/ldhf/htface_idiap_msceleb_inception_v2_centerloss_rgb/ \
  \
  --legends "Gabor Graph" --legends "LGBPHS" --legends "Classic LBP" \
  --legends "MultiScale LBP" --legends "MultiScale features" --legends "GFK" \
  --legends "Light CNN" --legends "VGG 16" \
  --legends "Incep.Resnet v1 gray" --legends "Incep.Resnet v1 RGB" \
  --legends "Incep.Resnet v2 gray" --legends "Incep.Resnet v2 RGB" \
  --report-name "casia-nir-vis-2.pdf" \
  --x-min 20 \
Note
It’s not necessary to run everything at once. Generate partial plots is a possibility. For more info check:
$ bob bio htface evaluate_and_squash --help
FARGO Experiments
The sequence of experiments in this subsection generates the necessary data to generate Figure 3.9 and Table 3.6.
First, the experiments should be generated:
$ bob bio htface htface_baseline gabor_graph fargo -vv
$ bob bio htface htface_baseline lgbphs fargo -vv
$ bob bio htface htface_baseline htface_classic_lbp fargo -vv
$ bob bio htface htface_baseline htface_lightcnn fargo -vv
$ bob bio htface htface_baseline htface_vgg16 fargo -vv
$ bob bio htface htface_baseline htface_idiap_msceleb_inception_v1_centerloss_gray fargo -vv
$ bob bio htface htface_baseline htface_idiap_msceleb_inception_v1_centerloss_rgb fargo -vv
$ bob bio htface htface_baseline htface_idiap_msceleb_inception_v2_centerloss_gray fargo -vv
$ bob bio htface htface_baseline htface_idiap_msceleb_inception_v2_centerloss_rgb fargo -vv
$ bob bio htface htface_baseline htface_mlbphs fargo -vv
$ bob bio htface htface_baseline htface_multiscale_features fargo -vv
$ bob bio htface htface_baseline htface_classic_lbp fargo -vv
Note
If you are at IDIAP, it is possible to trigger these experiements by setting –grid grid option. For more info check:
$ bob bio htface htface_baseline --help
Once the experiments are executed, the plots and metrics can be generated with the following command:
$ bob bio evaluate -la 0.01 \
  -e -v <experiment_path>/fargo/{gabor_graph,lgbphs,htface_classic_lbp,htface_mlbphs,htface_multiscale_features,htface_gfkgabor,htface_lightcnn,htface_vgg16,\
  htface_idiap_msceleb_inception_v1_centerloss_gray,\
  htface_idiap_msceleb_inception_v1_centerloss_rgb,\
  htface_idiap_msceleb_inception_v2_centerloss_gray,\
  htface_idiap_msceleb_inception_v2_centerloss_rgb}/mc-rgb2nir/mc-rgb2nir/nonorm/scores-{dev,eval} \
  --legends "Gabor Graph,LGBPHS,Classic LBP,MultiScale LBP,MultiScale features,GFK,Light CNN,VGG 16,Incep. Res. v1 gray,Incep. Res. v1 RGB,Incep. Res. v2 gray,Incep. Res. v2 RGB" \
  -l fargo_mc.txt -o fargo_mc.pdf
$ bob bio metrics -la 0.01 \
   -e -v <experiment_path>/fargo/{gabor_graph,lgbphs,htface_classic_lbp,htface_mlbphs,htface_multiscale_features,htface_gfkgabor,htface_lightcnn,htface_vgg16,\
   htface_idiap_msceleb_inception_v1_centerloss_gray,\
   htface_idiap_msceleb_inception_v1_centerloss_rgb,\
   htface_idiap_msceleb_inception_v2_centerloss_gray,\
   htface_idiap_msceleb_inception_v2_centerloss_rgb}/mc-rgb2nir/mc-rgb2nir/nonorm/scores-{dev,eval} \
   --legends "Gabor Graph,LGBPHS,Classic LBP,MultiScale LBP,MultiScale features,GFK,Light CNN,VGG 16,Incep. Res. v1 gray,Incep. Res. v1 RGB,Incep. Res. v2 gray,Incep. Res. v2 RGB" \
   -l fargo_mc.txt -o fargo_mc.pdf
Note
It’s not necessary to run everything at once. Generate partial plots is a possibility. For more info check:
$ bob bio evaluate --help
$ bob bio metrics --help
Pola Thermal Experiments
The sequence of experiments in this subsection generates the necessary data to generate Figure 3.10(a) and Table 3.7.
First, the experiments should be generated:
$ bob bio htface htface_baseline gabor_graph pola_thermal -vv
$ bob bio htface htface_baseline lgbphs pola_thermal -vv
$ bob bio htface htface_baseline htface_classic_lbp pola_thermal -vv
$ bob bio htface htface_baseline htface_lightcnn pola_thermal -vv
$ bob bio htface htface_baseline htface_vgg16 pola_thermal -vv
$ bob bio htface htface_baseline htface_idiap_msceleb_inception_v1_centerloss_gray pola_thermal -vv
$ bob bio htface htface_baseline htface_idiap_msceleb_inception_v1_centerloss_rgb pola_thermal -vv
$ bob bio htface htface_baseline htface_idiap_msceleb_inception_v2_centerloss_gray pola_thermal -vv
$ bob bio htface htface_baseline htface_idiap_msceleb_inception_v2_centerloss_rgb pola_thermal -vv
$ bob bio htface htface_baseline htface_mlbphs pola_thermal -vv
$ bob bio htface htface_baseline htface_multiscale_features pola_thermal -vv
$ bob bio htface htface_baseline htface_classic_lbp pola_thermal -vv
Note
If you are at IDIAP, it is possible to trigger these experiements by setting –grid grid option. For more info check:
$ bob bio htface htface_baseline --help
Once the experiments are executed, the plots and metrics can be generated with the following command:
$ bob bio htface evaluate_and_squash \
 \
  <experiment_path>/pola_thermal/gabor_graph/ \
  <experiment_path>/pola_thermal/lgbphs/ \
  <experiment_path>/pola_thermal/htface_classic_lbp/ \
  <experiment_path>/pola_thermal/htface_mlbphs/ \
  <experiment_path>/pola_thermal/htface_multiscale_features/ \
  <experiment_path>/pola_thermal/htface_gfkgabor/ \
  <experiment_path>/pola_thermal/htface_lightcnn/ \
  <experiment_path>/pola_thermal/htface_vgg16/ \
  <experiment_path>/pola_thermal/htface_idiap_msceleb_inception_v1_centerloss_gray/ \
  <experiment_path>/pola_thermal/htface_idiap_msceleb_inception_v1_centerloss_rgb/ \
  <experiment_path>/pola_thermal/htface_idiap_msceleb_inception_v2_centerloss_gray/ \
  <experiment_path>/pola_thermal/htface_idiap_msceleb_inception_v2_centerloss_rgb/ \
  \
  --legends "Gabor Graph" --legends "LGBPHS" --legends "Classic LBP" \
  --legends "MultiScale LBP" --legends "MultiScale features" --legends "GFK" \
  --legends "Light CNN" --legends "VGG 16" \
  --legends "Incep.Resnet v1 gray" --legends "Incep.Resnet v1 RGB" \
  --legends "Incep.Resnet v2 gray" --legends "Incep.Resnet v2 RGB" \
  --report-name "pola_thermal.pdf" \
  --x-min 20 \
Note
It’s not necessary to run everything at once. Generate partial plots is a possibility. For more info check:
$ bob bio htface evaluate_and_squash --help
If everything goes alright the following plot should be dumped
Thermal Experiments
The sequence of experiments in this subsection generates the necessary data to generate Figure 3.10(b) and Table 3.7
First, the experiments should be generated:
$ bob bio htface htface_baseline gabor_graph thermal -vv
$ bob bio htface htface_baseline lgbphs thermal -vv
$ bob bio htface htface_baseline htface_classic_lbp thermal -vv
$ bob bio htface htface_baseline htface_lightcnn thermal -vv
$ bob bio htface htface_baseline htface_vgg16 thermal -vv
$ bob bio htface htface_baseline htface_idiap_msceleb_inception_v1_centerloss_gray thermal -vv
$ bob bio htface htface_baseline htface_idiap_msceleb_inception_v1_centerloss_rgb thermal -vv
$ bob bio htface htface_baseline htface_idiap_msceleb_inception_v2_centerloss_gray thermal -vv
$ bob bio htface htface_baseline htface_idiap_msceleb_inception_v2_centerloss_rgb thermal -vv
$ bob bio htface htface_baseline htface_mlbphs thermal -vv
$ bob bio htface htface_baseline htface_multiscale_features thermal -vv
$ bob bio htface htface_baseline htface_classic_lbp thermal -vv
Note
If you are at IDIAP, it is possible to trigger these experiements by setting –grid grid option. For more info check:
$ bob bio htface htface_baseline --help
Once the experiments are executed, the plots and metrics can be generated with the following command:
$ bob bio htface evaluate_and_squash \
 \
  <experiment_path>/thermal/gabor_graph/ \
  <experiment_path>/thermal/lgbphs/ \
  <experiment_path>/thermal/htface_classic_lbp/ \
  <experiment_path>/thermal/htface_mlbphs/ \
  <experiment_path>/thermal/htface_multiscale_features/ \
  <experiment_path>/thermal/htface_gfkgabor/ \
  <experiment_path>/thermal/htface_lightcnn/ \
  <experiment_path>/thermal/htface_vgg16/ \
  <experiment_path>/thermal/htface_idiap_msceleb_inception_v1_centerloss_gray/ \
  <experiment_path>/thermal/htface_idiap_msceleb_inception_v1_centerloss_rgb/ \
  <experiment_path>/thermal/htface_idiap_msceleb_inception_v2_centerloss_gray/ \
  <experiment_path>/thermal/htface_idiap_msceleb_inception_v2_centerloss_rgb/ \
  \
  --legends "Gabor Graph" --legends "LGBPHS" --legends "Classic LBP" \
  --legends "MultiScale LBP" --legends "MultiScale features" --legends "GFK" \
  --legends "Light CNN" --legends "VGG 16" \
  --legends "Incep.Resnet v1 gray" --legends "Incep.Resnet v1 RGB" \
  --legends "Incep.Resnet v2 gray" --legends "Incep.Resnet v2 RGB" \
  --report-name "thermal.pdf" \
  --x-min 20 \
Note
It’s not necessary to run everything at once. Generate partial plots is a possibility. For more info check:
$ bob bio htface evaluate_and_squash --help
If everything goes alright the following plot should be dumped
Relevant publications for this Section
- [pdf1] T. d. F. Pereira, A. Anjos and S. Marcel, “Heterogeneous Face Recognition Using Domain Specific Units,” in IEEE Transactions on Information Forensics and Security. doi: 10.1109/TIFS.2018.2885284
- [pdf2] SEQUEIRA, ANA, et al. “Cross-Eyed 2017: Cross-Spectral Iris/Periocular Recognition Competition.” IEEE/IAPR International Joint Conference on Biometrics. No. EPFL-CONF-233586. IEEE, 2017.