Results
This section summarizes results that can be obtained with this package.
Models optimization
In the link below, you will find information about the optimization of each model we used.
Models training runtime and memory footprint
In the link below, you will find information about the training runtime and the memory footprint of each model we used.
AUROC Scores
Benchmark results for models: Pasa, DenseNet, SignsToTB
Each dataset is split in a training, a validation and a testing subset
Datasets names are abbreviated as follows: Montgomery (MC), Shenzhen (CH), Indian (IN)
Models are only trained on the training subset
During the training session, we keep checkpoints for the best performing networks based on the validation set. The best performing network during training is used for evaluation.
Model resource configuration links are linked to the originating configuration files used to obtain these results.
K-folding
Stratified k-folding has been used (10 folds) to generate these results.
Tip
To generate the following results, you first need to predict TB on each fold, then use the aggregpred command to aggregate the predictions together, and finally evaluate this new file using the compare command.
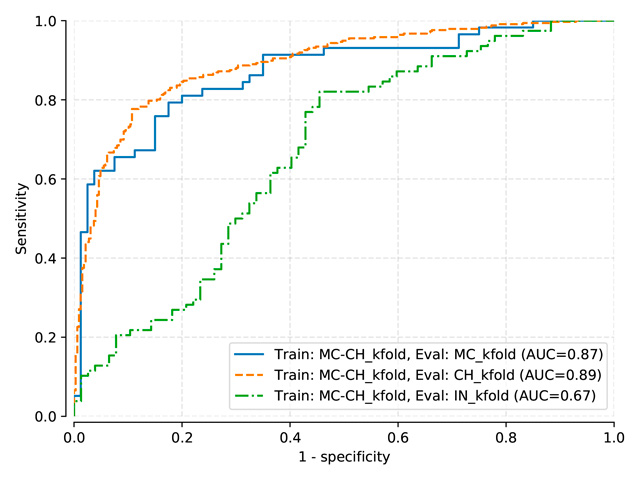
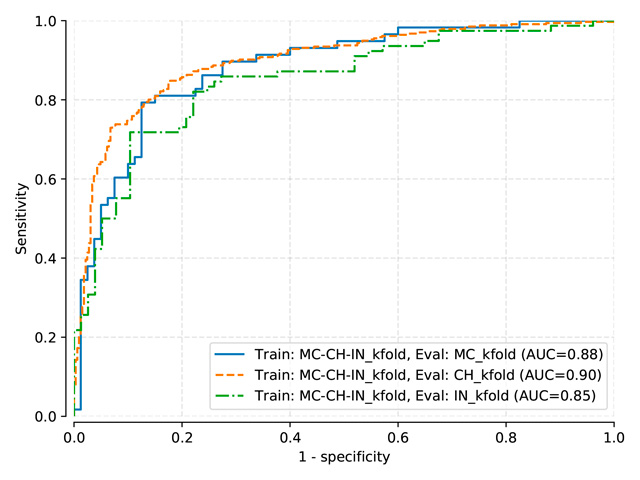
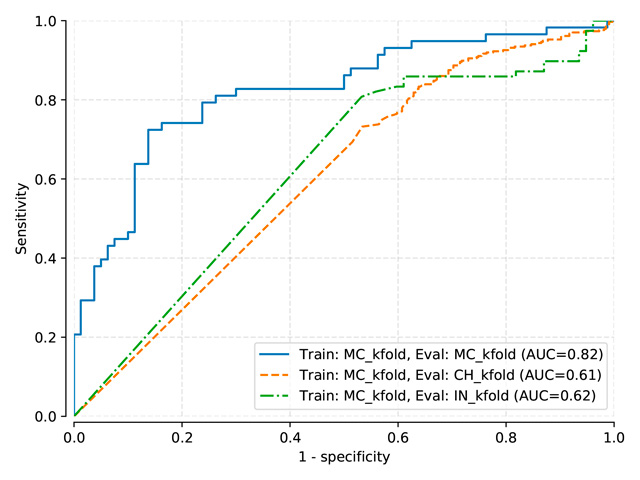
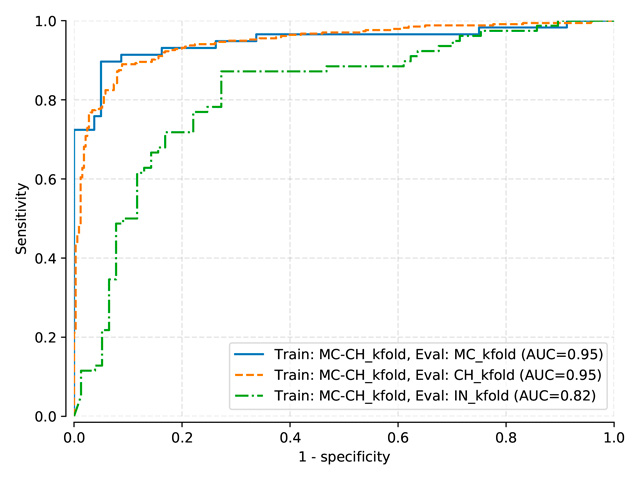
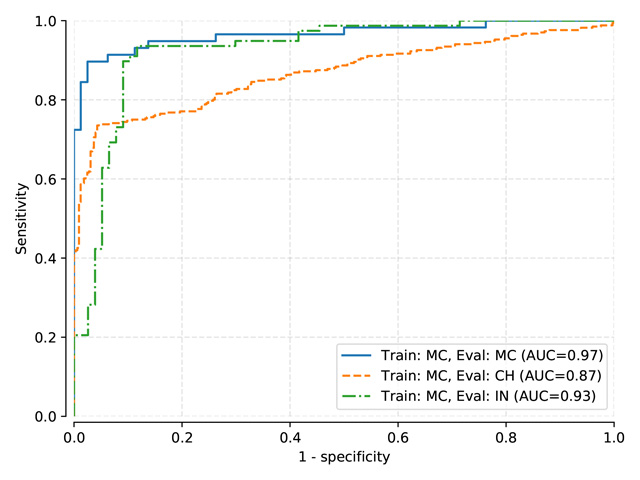
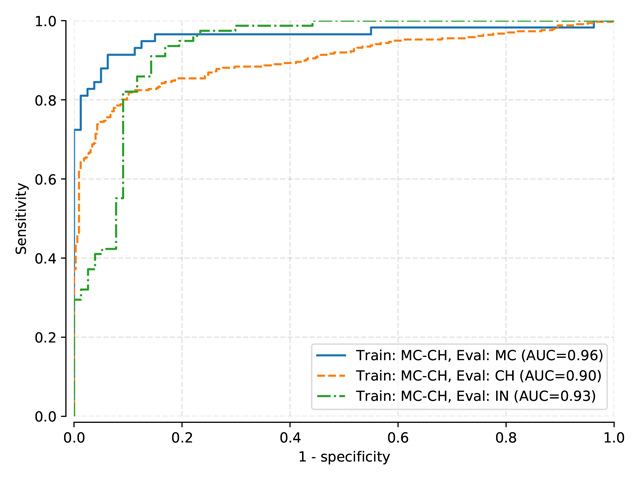
Pasa and DenseNet-121 (random initialization)
Thresholds used:
Pasa trained on MC, test on MC, mean threshold: 0.5057
Pasa trained on MC-CH, test on MC-CH, mean threshold: 0.4966
Pasa trained on MC-CH-IN, test on MC-CH-IN, mean threshold: 0.4135
Densenet trained on MC, test on MC, mean threshold: 0.5183
Densenet trained on MC-CH, test on MC-CH, mean threshold: 0.2555
Densenet trained on MC-CH-IN, test on MC-CH-IN, mean threshold: 0.4037
AUC |
MC test |
CH test |
IN test |
Pasa (train: MC) |
0.890 |
0.576 |
0.642 |
Pasa (train: MC+CH) |
0.870 |
0.893 |
0.669 |
Pasa (train: MC+CH+IN) |
0.881 |
0.898 |
0.848 |
DenseNet-121 (train: MC) |
0.822 |
0.607 |
0.625 |
DenseNet-121 (train: MC+CH) |
0.883 |
0.905 |
0.672 |
DenseNet-121 (train: MC+CH+IN) |
0.860 |
0.917 |
0.850 |
|
|
|
|
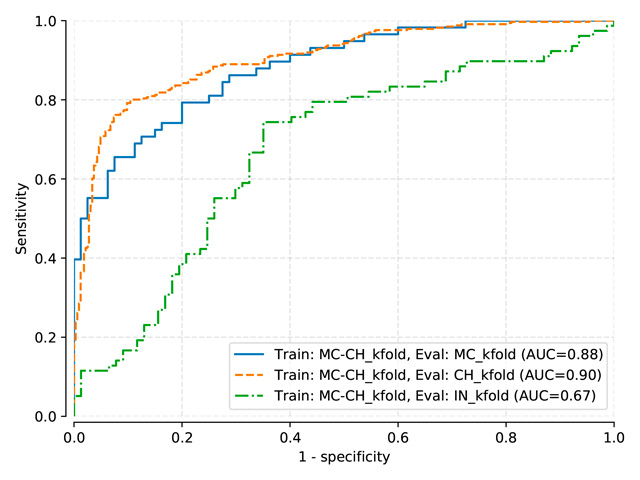
Fig. 5 |
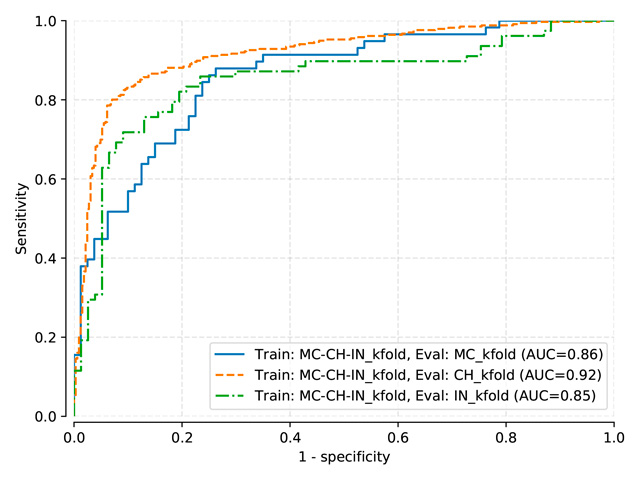
Fig. 6 |
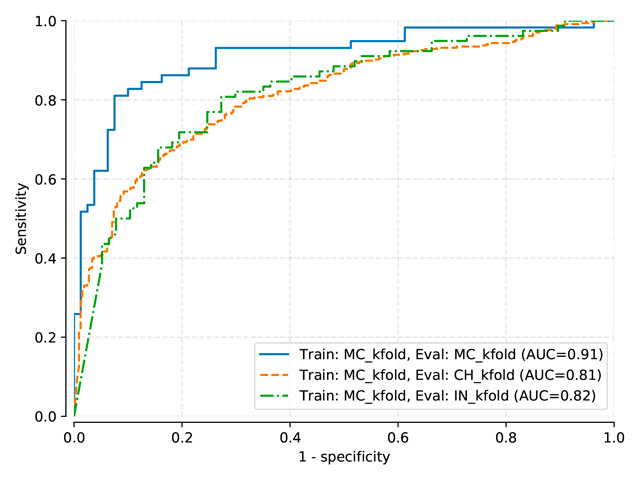
DenseNet-121 (pretrained on ImageNet)
Thresholds used:
DenseNet (pretrained on ImageNet) trained on MC, test on MC, mean threshold: 0.3581
DenseNet (pretrained on ImageNet) trained on MC-CH, test on MC-CH, mean threshold: 0.3319
DenseNet (pretrained on ImageNet) trained on MC-CH-IN, test on MC-CH-IN, mean threshold: 0.4048
AUC |
MC test |
CH test |
IN test |
DenseNet-121 (train: MC) |
0.910 |
0.814 |
0.817 |
DenseNet-121 (train: MC+CH) |
0.948 |
0.946 |
0.816 |
DenseNet-121 (train: MC+CH+IN) |
0.925 |
0.944 |
0.911 |
|
|
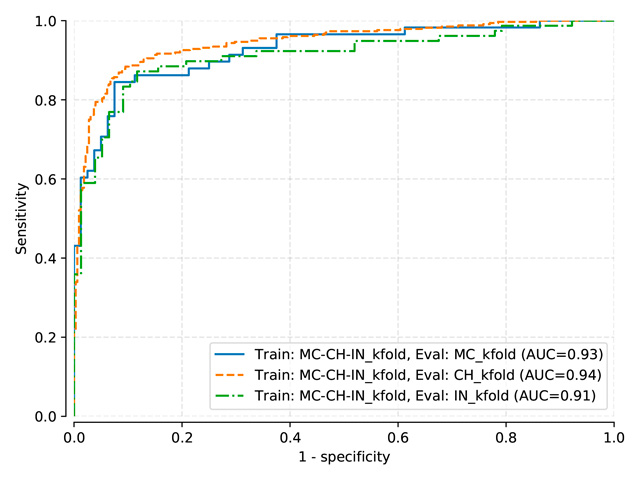
Fig. 9 |
Logistic Regression Classifier
Thresholds used:
LogReg trained on MC, test on MC, mean threshold: 0.534
LogReg trained on MC-CH, test on MC-CH, mean threshold: 0.2838
LogReg trained on MC-CH-IN, test on MC-CH-IN, mean threshold: 0.2371
AUC |
MC test |
CH test |
IN test |
Indirect (train: MC) |
0.966 |
0.867 |
0.926 |
Indirect (train: MC+CH) |
0.961 |
0.901 |
0.928 |
Indirect (train: MC+CH+IN) |
0.951 |
0.895 |
0.920 |
|
|
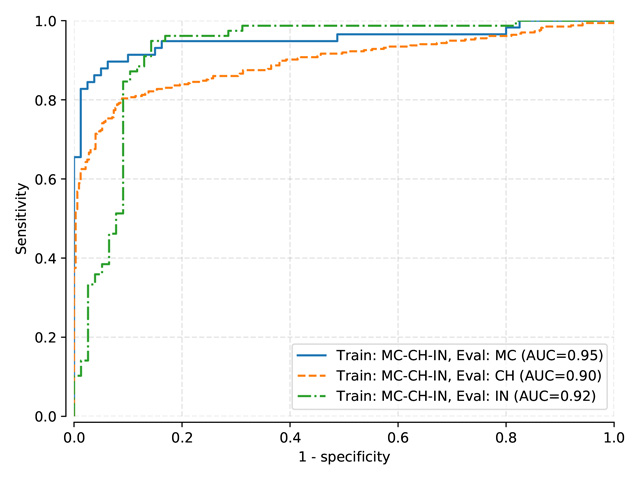
Fig. 12 |
DenseNet-121 (pretrained on ImageNet and NIH CXR14)
Thresholds used:
DenseNetPre trained on MC, test on MC, mean threshold: 0.4126
DenseNetPre trained on MC-CH, test on MC-CH, mean threshold: 0.3711
DenseNetPre trained on MC-CH-IN, test on MC-CH-IN, mean threshold: 0.4255
AUC |
MC test |
CH test |
IN test |
DenseNet-121 (train: MC) |
0.966 |
0.917 |
0.901 |
DenseNet-121 (train: MC+CH) |
0.984 |
0.979 |
0.869 |
DenseNet-121 (train: MC+CH+IN) |
0.965 |
0.978 |
0.931 |
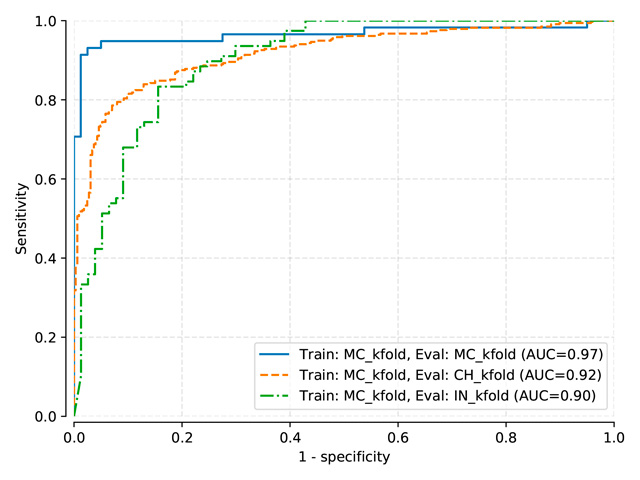
Fig. 13 |
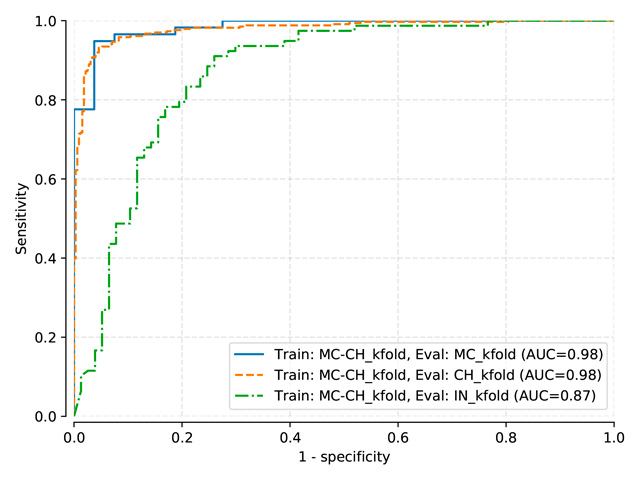
Fig. 14 |
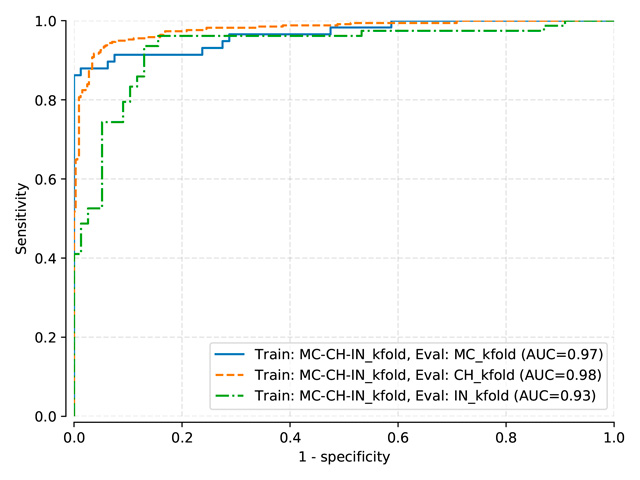
Fig. 15 |
Global sensitivity analysis (relevance)
Model used to generate the following figures: LogReg trained on MC-CH-IN fold 0 for 100 epochs.
Tip
Use the --relevance-analysis argument of the predict command to generate the following plots.
Green color: likely TB
Orange color: Could be TB
Dark red color: Unlikely TB
As CH is the largest dataset, its relevance analysis is computed on more images and is supposed to be more stable. Similarly, train sets are larger. We notice the systematic importance of Nodule, Pleural Thickening, Fibrosis, Mass, Consolidation and Pleural Effusion.
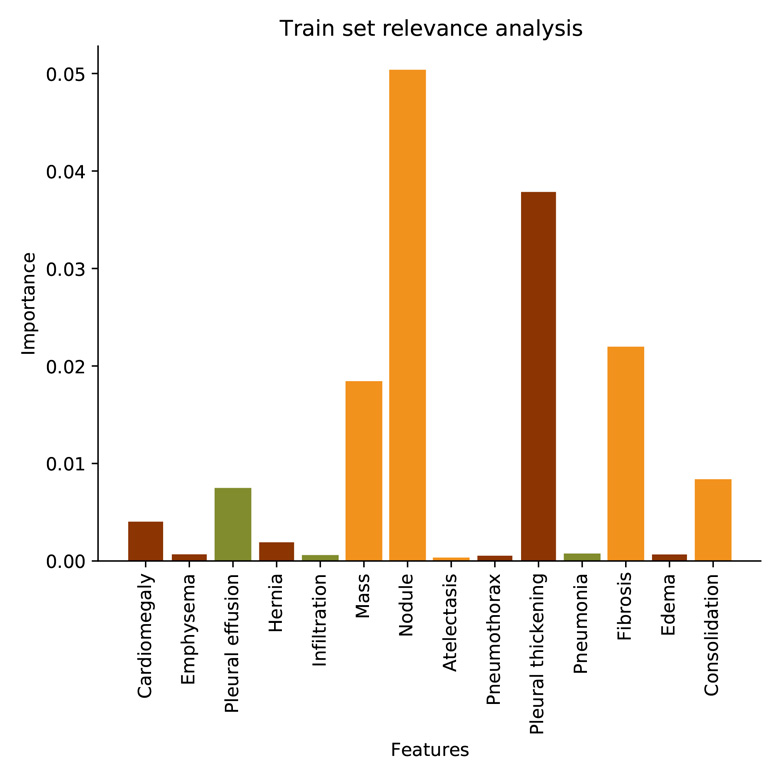
Fig. 16 Relevance analysis on train MC¶ |
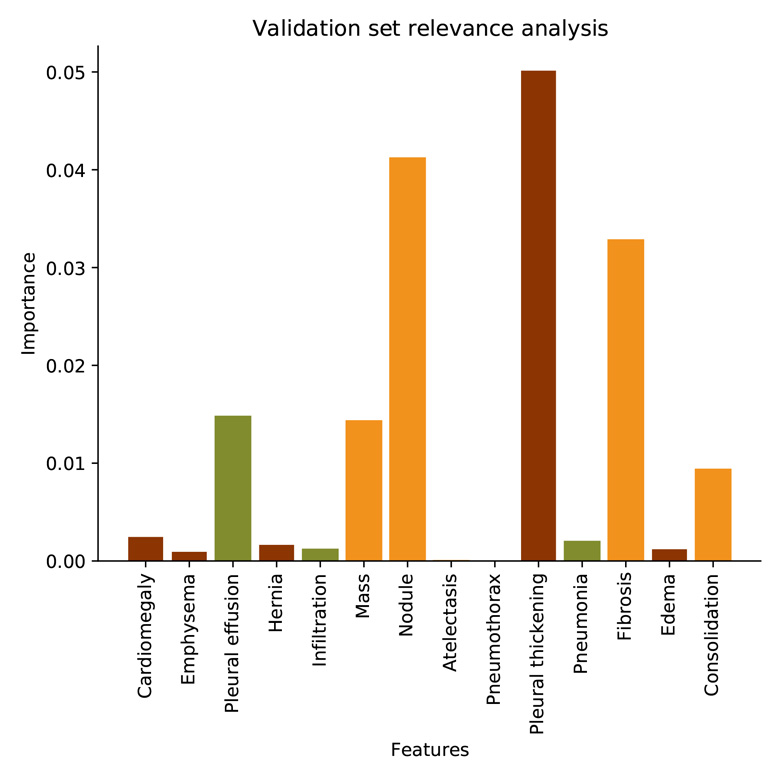
Fig. 17 Relevance analysis on validation MC¶ |
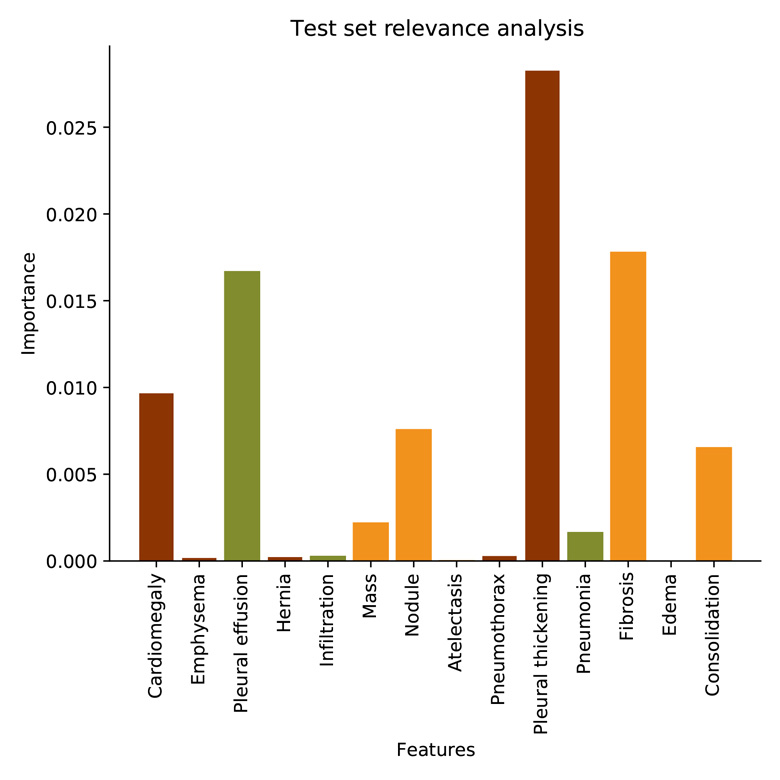
Fig. 18 Relevance analysis on test MC¶ |
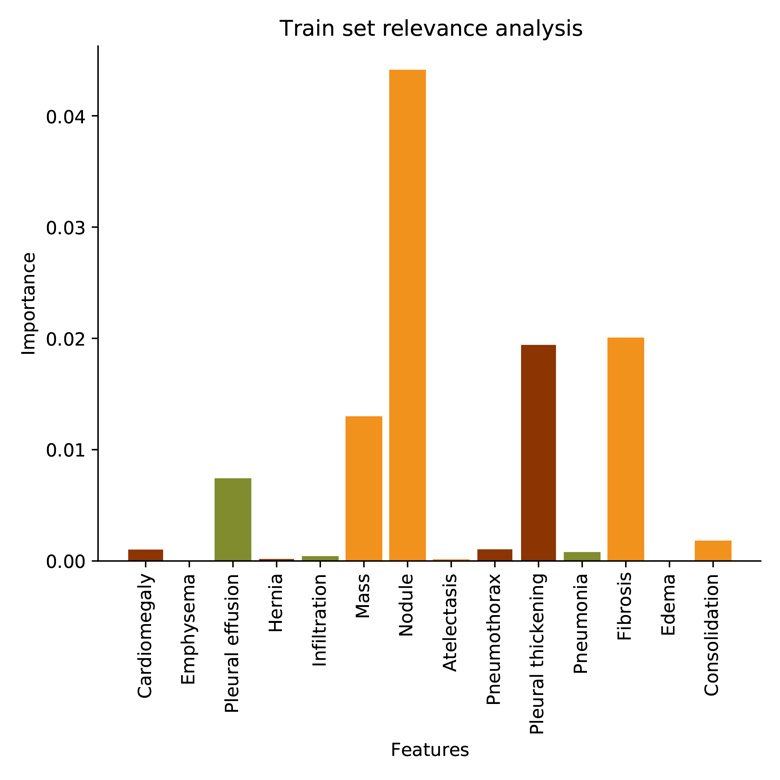
Fig. 19 Relevance analysis on train CH¶ |
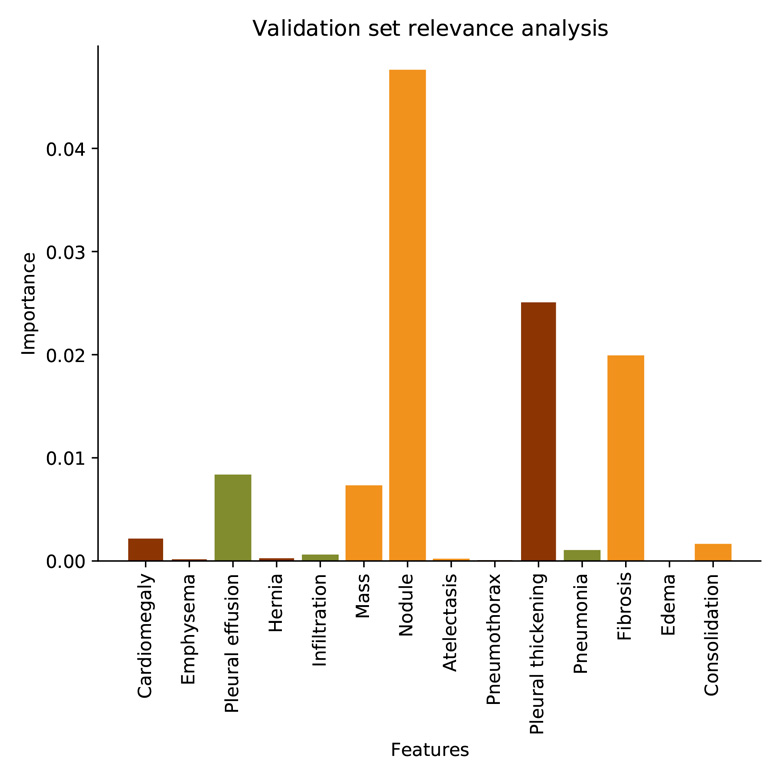
Fig. 20 Relevance analysis on validation CH¶ |
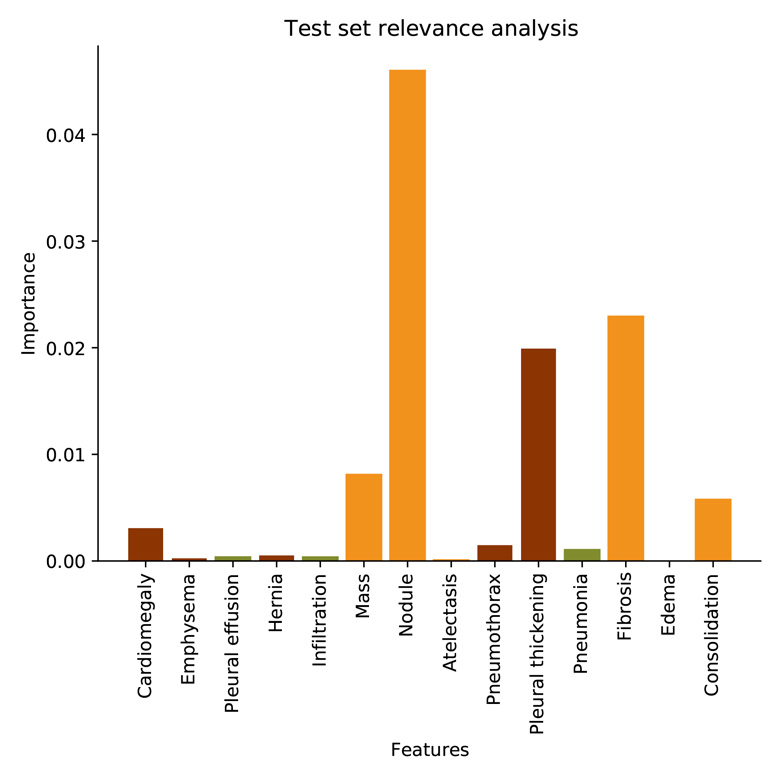
Fig. 21 Relevance analysis on test CH¶ |
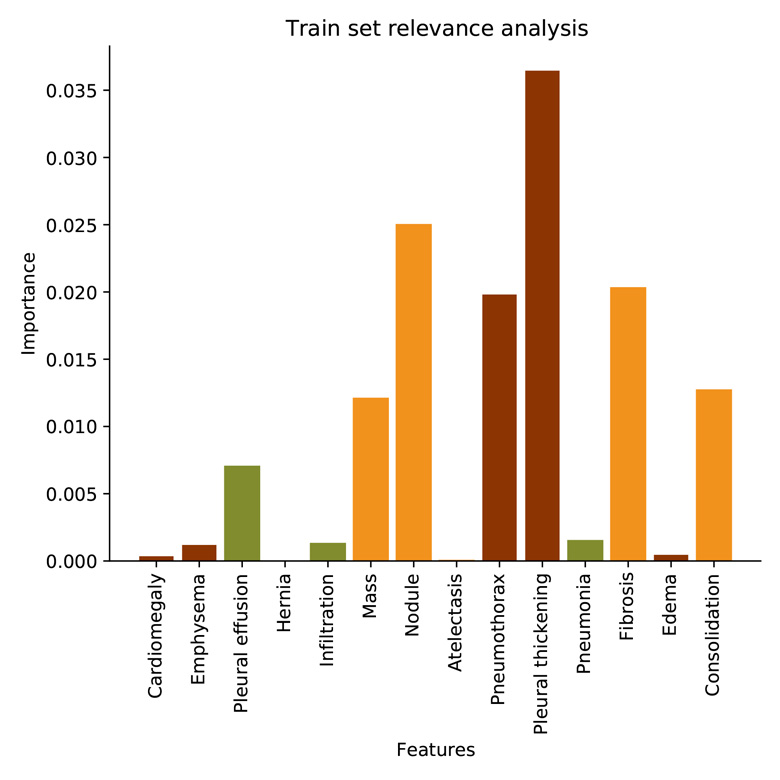
Fig. 22 Relevance analysis on train IN¶ |
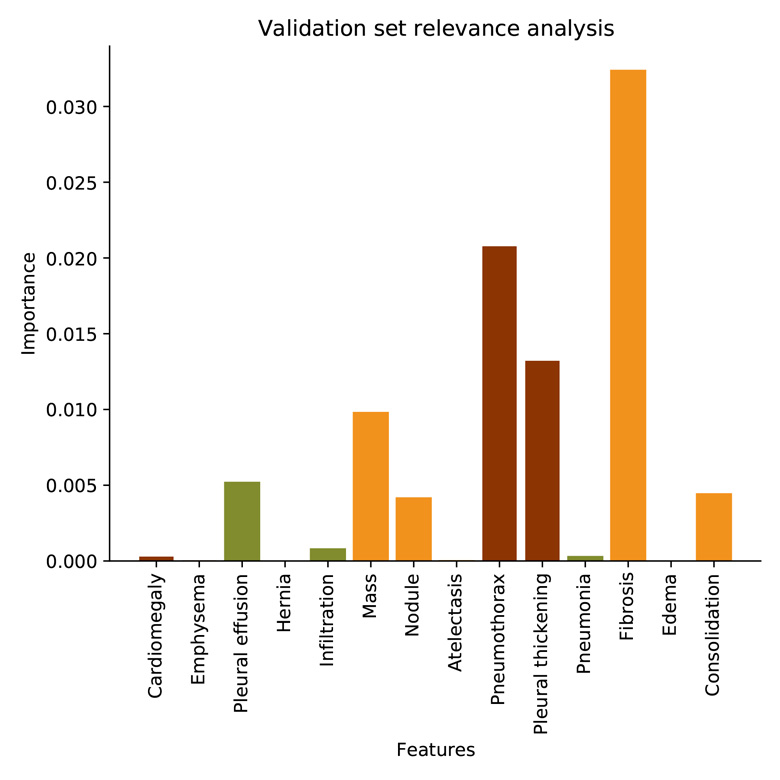
Fig. 23 Relevance analysis on validation IN¶ |
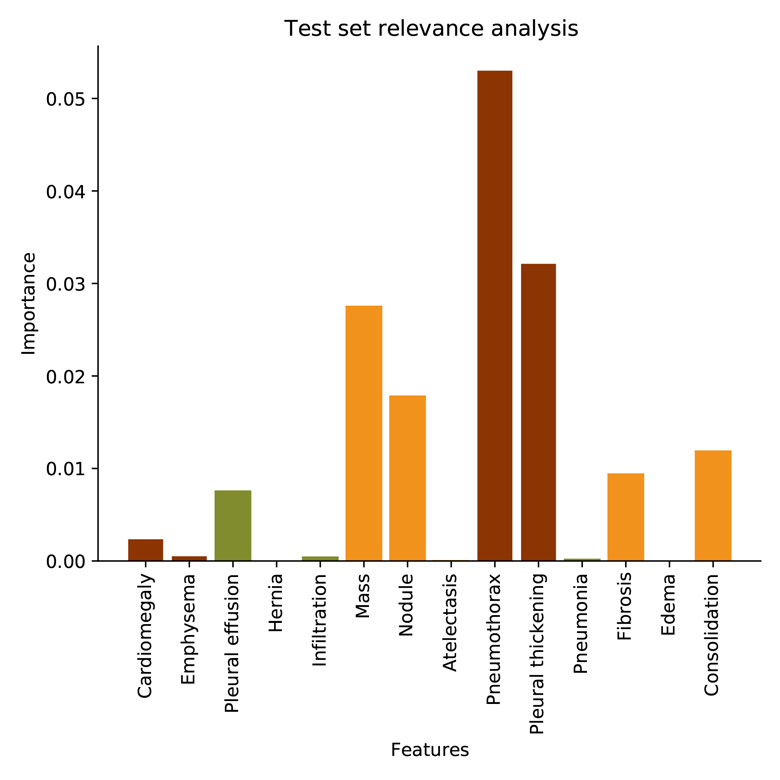
Fig. 24 Relevance analysis on test IN¶ |
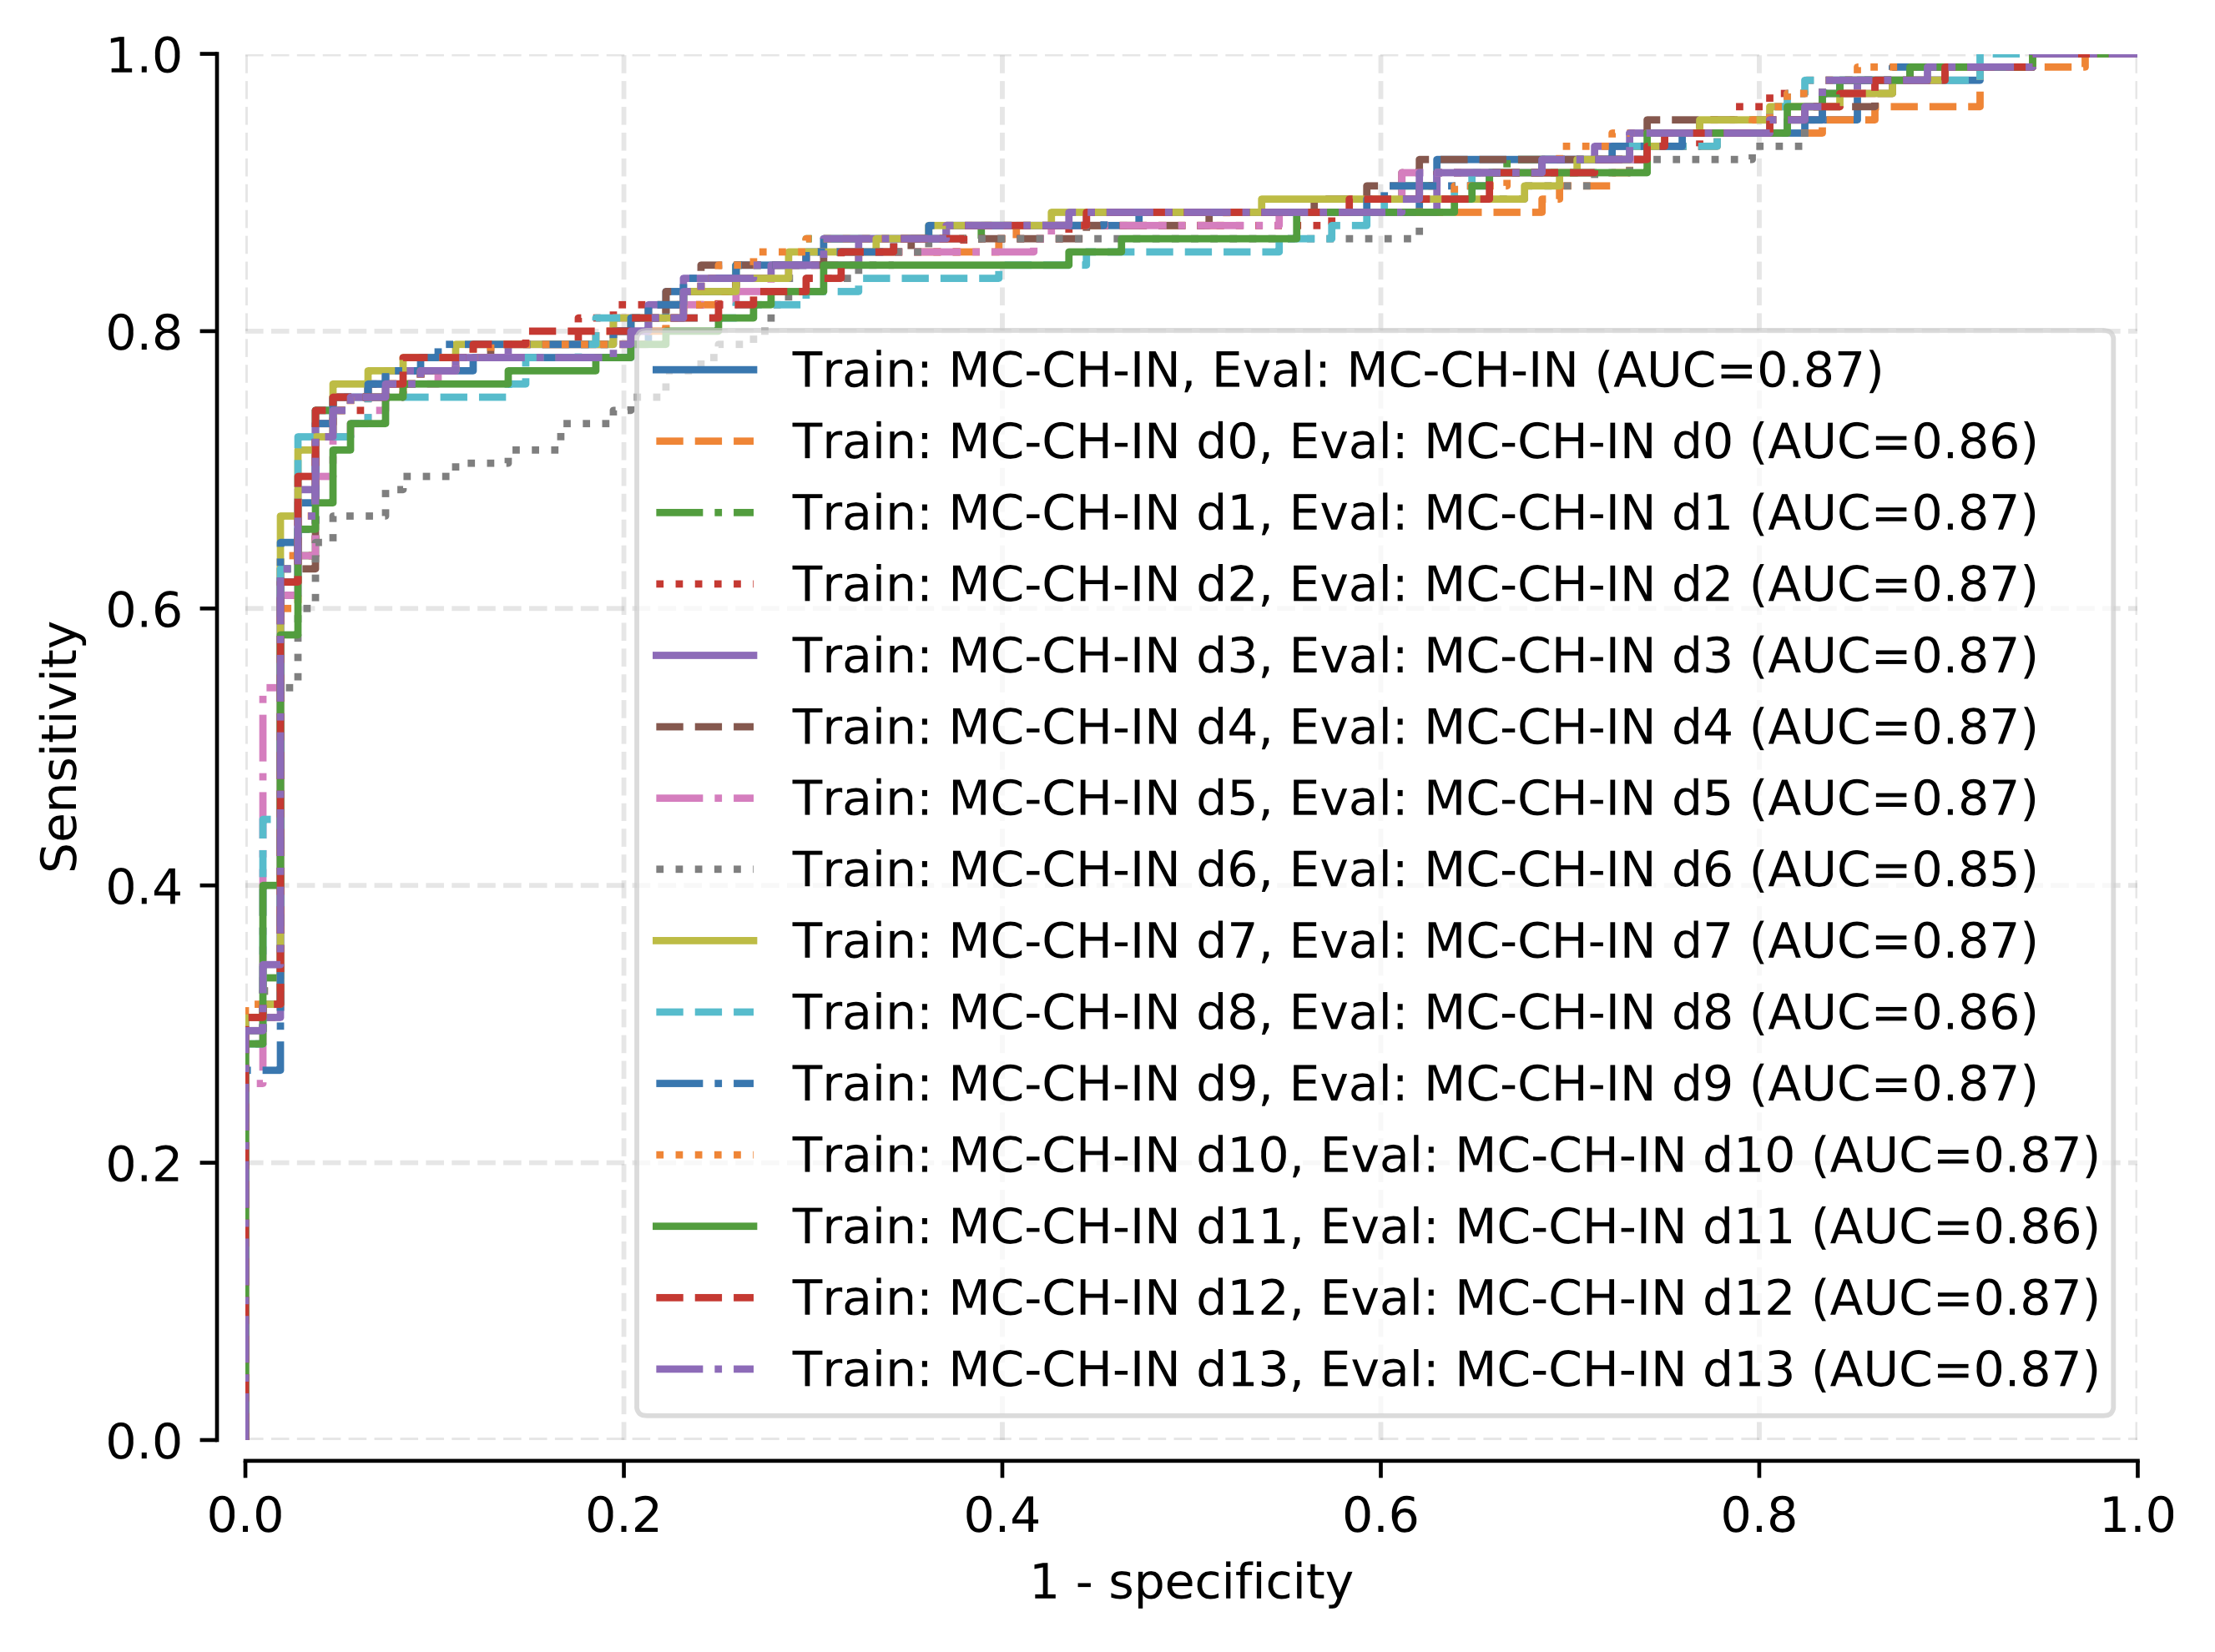
Ablation study
Here, we removed the data of each sign, one after the other, from the dataset for both model training and prediction. LogReg trained on MC-CH-IN fold 0 for 100 epochs has been used to generate the following plot.
Predictive capabilities of our logistic regression model after removing the data for each radiological sign (d0-d13 correspond, in this order, to cardiomegaly, emphysema, effusion, hernia, infiltration, mass, nodule, atelectasis, pneumothorax, pleural thickening, pneumonia, fibrosis, edema, and consolidation).