Leaderboard
Next sections presents the leaderboard for each face database and its correspondent evaluation protocols.
Mobio
Testing only the mobio-male protocol.
System ERR (dev) HTER (eval) VGG16 2.58% 3.09% Facenet 0.56% 0.22% DrGAN 0.8% 2.6% CasiaNET 16.2% 9.9% CNN8 14.8% 14.9% Casia WebFace - Resnetv1 center loss gray 2.46% 1.34% Casia WebFace - Resnetv1 center loss RGB 1.7% 0.95% Casia WebFace - Resnetv2 center loss gray 2.77% 1.80% Casia WebFace - Resnetv2 center loss RGB 1.23% 0.89% MSCeleb - Resnetv1 center loss gray 1.51% 0.49% MSCeleb - Resnetv1 center loss RGB 2.07% 0.73% MSCeleb - Resnetv2 center loss gray 1.63% 0.88% MSCeleb - Resnetv2 center loss RGB 0.33% 0.29% ISV 3.2% 7.5%
To run each one of these baselines do:
$ bob bio baseline vgg16 mobio-male
$ bob bio baseline facenet mobio-male
$ bob bio baseline casianet mobio-male
$ bob bio baseline cnn8 mobio-male
$ bob bio baseline idiap_casia_inception_v1_centerloss_gray mobio-male
$ bob bio baseline idiap_casia_inception_v1_centerloss_rgb mobio-male
$ bob bio baseline idiap_casia_inception_v2_centerloss_gray mobio-male
$ bob bio baseline idiap_casia_inception_v2_centerloss_rgb mobio-male
$ bob bio baseline idiap_msceleb_inception_v1_centerloss_gray mobio-male
$ bob bio baseline idiap_msceleb_inception_v1_centerloss_rgb mobio-male
$ bob bio baseline idiap_msceleb_inception_v2_centerloss_gray mobio-male
$ bob bio baseline idiap_msceleb_inception_v2_centerloss_rgb mobio-male
$ bob bio baseline isv mobio-male
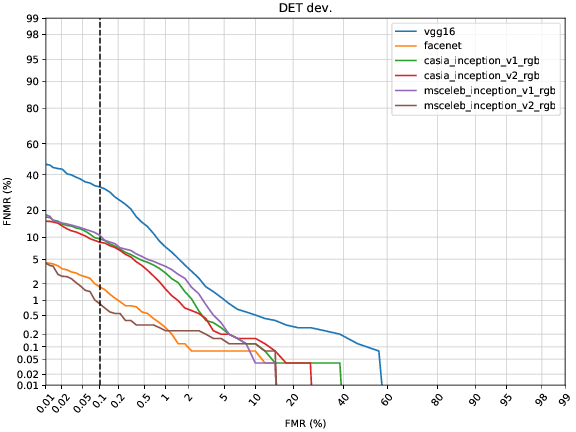
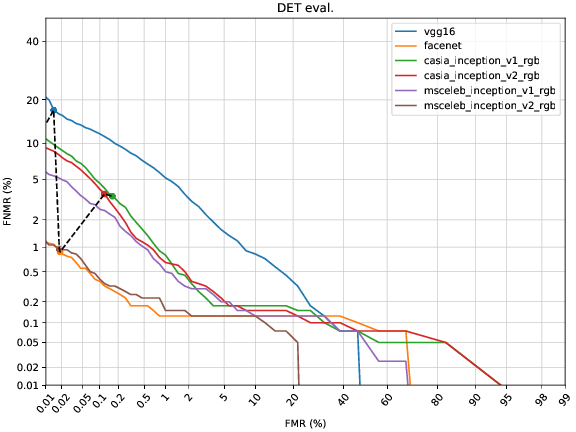
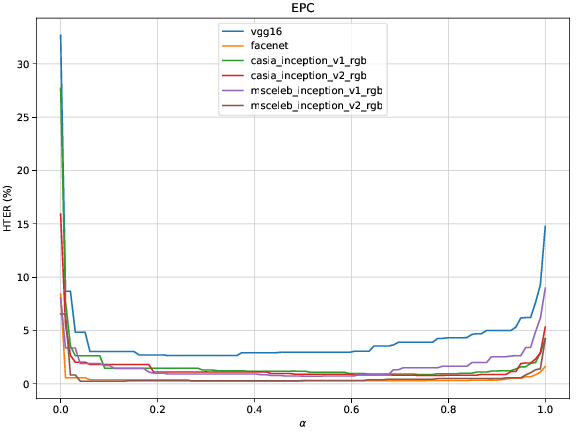
Follow below the DET curves for the development and dev sets, and the EPC for the best systems
LFW
LFW presents a 10 fold evaluation protocol for open-set identification. Follow below the average True Positive Identification Rate measures under different False Alarm Rates (10 folds averaging).
System TPIR% (FAR=0.1) TPIR% (FAR=0.01) TPIR% (FAR=0.001) VGG16 Facenet 99.6 (0.66) 98.37 (0.82) 93.13 (3.71) Dr GAN 97.45 (0.96) 88.41 (1.81) 75.27 (10.12) CasiaNET 96.81 (0.91) 52.0 (8.87) 13.13 (6.76) CNN8 96.93 (0.83) 45.55 (11.85) 15.63 (10.98) Casia WebFace - Resnetv1 cross loss gray 98.29 (0.91) 93.18 (1.57) 79.16 (9.6) Casia WebFace - Resnetv1 cross loss rgb 98.36 (0.56) 92.53 (1.54) 77.53 (11.13) Casia WebFace - Resnetv2 center loss gray 98.51 (0.64) 91.68 (2.13) 79.91 (4.97) Casia WebFace - Resnetv2 center loss rgb 98.58 (0.65) 92.18 (1.68) 78.9 (10.35) MSCeleb - Resnetv2 center loss rgb 99.77 (0.19 ) 99.18 (0.43 ) 77.75 (30.82)
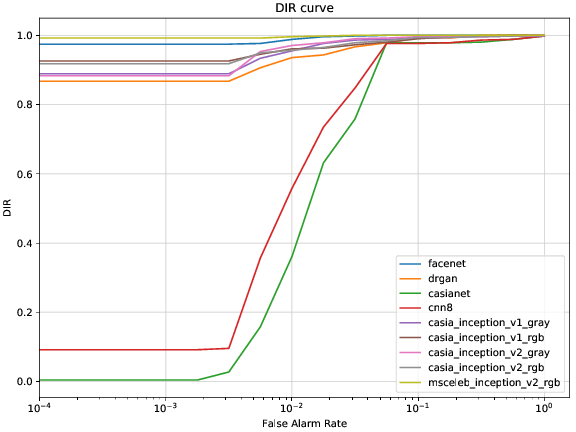
Since these protocols are open-set, another way analyse this dataset is via an Open Set Identification evaluation. Follow below Detection Identification Rate for the first fold.
IJB-C
Verification protocol 1:1
This section presents the results for verification (1:1) protocol. Check here for more details.
| System | TPIR% (FAR=0.1) | TPIR% (FAR=0.01) | TPIR% (FAR=0.001) |
|---|---|---|---|
| VGG16 | |||
| Facenet | 97.137 | 85.944 | 64.979 |
| Dr GAN | 90.397 | 62.152 | 31.912 |
| CasiaNET | 17.799 | 4.341 | 0.92 |
| CNN8 | 17.871 | 4.709 | 0.997 |
| Casia WebFace - Resnetv1 center loss gray | 90.597 | 67.945 | 41.402 |
| Casia WebFace - Resnetv1 center loss rgb | 90.985 | 68.4 | 42.041 |
| Casia WebFace - Resnetv2 center loss gray | 90.806 | 66.754 | 39.577 |
| Casia WebFace - Resnetv2 center loss rgb | 90.633 | 67.388 | 41.837 |
| MSCeleba - Resnetv2 center loss rgb | 99.0 | 91.55 | 62.53 |
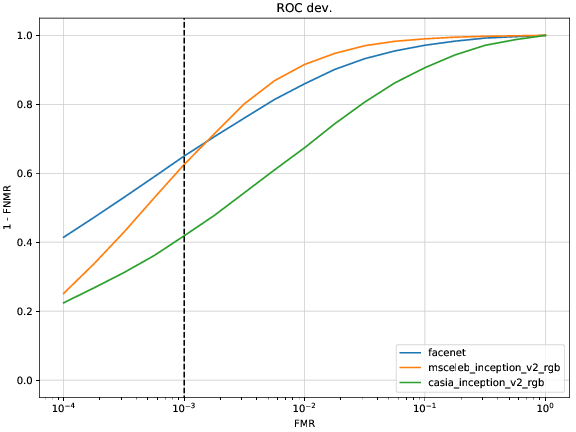
Follow below the ROC curve of the three best evaluated systems.