Vulnerability analysis
When developing a biometric system, one could be interested in knowing how it performs when under attack. This is where the vulnerability to presentation attacks comes in. This analysis allows to test a variety of attacks and assess the cases where a biometric system is fooled.
For more details on the vulnerability analysis of biometric systems, refer to [Chingovska_SPRINGER_2019].
To evaluate a biometric system for vulnerability to presentation attack, three steps must be accomplished:
Preparing the data to feed the biometric system (using a
CSVDataset);Running a pipeline to generate comparison scores (
bob bio pipelines);Analyzing the resulting scores to assess the performance of the system (
bob vulnerabilitycommands).
Using a CSVDataset
A CSVDataset interface is needed to correctly feed the data to the
PipelineSimple.
You can use an already existing configuration (like replaymobile-img), when
present.
If not, you will need to create your own. To do so, you need at least those three
elements:
The raw data files (e.g. face images or videos);
A series of CSV protocol files;
A configuration file instantiating the
CSVDatasetwith your parameters.
In some specific cases (e.g. frames needing to be extracted from a video file), the
base CSVDataset could not satisfy your needs, and a new class inheriting from it
would have to be implemented.
Data files
The data files are never provided via the bob packages, as they contain private biometric information that can not be distributed. You have to retrieve them from their author (sometimes requiring a consent form to be approved) or create your own.
CSV protocol files
These files define which sample from the data files will be used and for which purpose (training, enrollment, or probe). A specific file structure must be observed, as well as some formatting rules in the files.
File structure of the CSV protocol files
The CSV protocol files must be ordered in the following structure with the correct file names:
<your_dataset_name>
|
+-- <your_protocol_name_1>
|   |
|   +-- dev
|       |
|       +-- for_models.csv
|       +-- for_probes.csv
|
+-- <your_protocol_name_2>
.   |
.   +-- norm
.   |   |
    |   +-- train_world.csv
    |
    +-- dev
    |   |
    |   +-- for_models.csv
    |   +-- for_probes.csv
    |
    +-- eval
        |
        +-- for_models.csv
        +-- for_probes.csv
Each subfolder of the top-level folder contains a protocol definition whose name can be
chosen and will be compared to the protocol_name parameter passed in the
CSVDataset configuration.
Each protocol folder must contain at least a dev folder and can contain a norm
and/or an eval folder.
The dev and eval folders each contain a for_models.csv file that will be
used to enroll the samples listed in it, and a for_probes.csv file that contains
the genuine and attack probes samples that will be compared to the enrolled models.
CSV protocol files format
Each CSV file must contain a header and its content must be separated by commas. The
required columns for vulnerability analysis are path and reference_id.
Other column fields (metadata) will be processed by the CSVDataset class and
passed through the samples to the pipeline.
Each row of the CSV files will result in one sample being created (each frame of a
video must be one row when processing images).
The attack_type field can be omitted in the model files but must be present in the
probe files. When the sample is not an attack, the attack_type field should be
empty, otherwise, it represents the type of attack used.
Minimal protocol definition CSV file for the enrollment (for_models.csv):
PATH,REFERENCE_ID
enroll/client01/im01,1
enroll/client01/im02,1
enroll/client02/im01,2
enroll/client02/im02,2
...
Minimal vulnerability probes protocol definition CSV file (for_probes.csv), where
each row corresponds to one comparison (is_sparse needs to be set in the
CSVDataset):
PATH, REFERENCE_ID, ATTACK_TYPE, COMPARE_REFERENCE_ID
probe/client01/im01,1,,1
probe/client01/im01,1,,2
probe/client01/im01,1,,3
probe/client01/im01,1,,4
probe/client01/im01,1,spoof,1
probe/client02/im01,2,,1
probe/client02/im01,2,,2
probe/client02/im01,2,,3
probe/client02/im01,2,,4
probe/client02/im01,2,spoof,2
...
Note that building the probe file this way (instead of one rew per probe) is recommended
to prevent the computation of attack probes against unrelated references.
The compare_reference_id specifies to which reference the probe will be compared to.
The CSVDataset interface
If you want to use a dataset that is already configured for bob vulnerability you don’t
need to create the configuration file in this step; you can use the one provided in the
bob package (see next chapter, using replaymobile-img).
Otherwise, once you have the protocol files and the data, you can define a
configuration file to input in the PipelineSimple pipeline. This configuration
file must assign a database object to an instance of
bob.bio.base.database.CSVDataset (or your own inheriting class if some
special processing is needed for the loading of your samples).
To use the default CSVDataset for your dataset, the python configuration file to
use can be in the form:
from bob.bio.base.database import CSVDataset, CSVToSampleLoaderBiometrics

database = CSVDataset(
    dataset_protocol_path="path/to/definition/of/your_dataset_name",
    protocol_name="your_protocol_name",
    sample_loader=CSVToSampleLoaderBiometrics(
        data_loader=bob.io.base.load,
        dataset_original_directory="path/to/raw_data_folder",
        extension=".png",
    ),
    is_sparse=True,
)
The is_sparse parameter is used in pair with the compare_reference_id column in
the CSV definition files. It allows to define specifically which comparisons should be
computed, by defining each row as one comparison between a probe sample and the
reference specified in the compare_reference_id column.
The custom configuration file (custom_database_config.py, here) has to be given as
parameter to the PipelineSimple command:
$ bob bio pipeline simple custom_database_config.py facenet-sanderberg
Computing the scores
To evaluate a biometric system, a series of samples coming from a dataset is compared to multiple enrolled models, and each comparison should result in a score. Generally, the score should be high if the compared samples come from the same individual represented in the model.
In the case of vulnerability analysis, presentation attack samples are also compared to the enrolled model of the attacked individual and give a score. Ideally, the system should not recognize the attack sample and return a low score to those comparisons. But if the attack is well crafted enough to fool the system, these attack samples will pass as genuine and score higher.
To compute the comparison scores of a dataset on a system, the PipelineSimple pipeline can be used. For a face presentation attack analysis (using the replay mobile dataset as an example) on a face recognition system (Facenet from Sandberg, in this case), use the following command:
$ bob bio pipeline simple -v --output ./results \
  --group dev --group eval replaymobile-img facenet-sanderberg
replaymobile-img points to a python configuration file defining a database
object.
facenet-sanderberg points to a python configuration file defining a pipeline
object.
Note
The data (face images) is not provided in the bob packages, as it contains
private information. Only the protocol definition files and annotations are available
and will be automatically downloaded unless specified, as they are anonymous.
You must acquire the data files and specify their location using the bob config
command, or specifying it in your own configuration files.
When using replaymobile-img, do:
$ bob config set bob.db.replaymobile.directory /your/path/to/replay-mobile/database
Analyzing the scores
To evaluate the performance of the system, we can analyze the distribution of
scores generated by the pipelines command. This analysis step includes a series of
commands that generate plots and tables of metrics. Those are useful to assess the
performance and vulnerability of the system or to compare multiple systems’
performance.
Each command is in the form:
$ bob vulnerability <command> <options> <score files>
or alternatively:
$ bob vuln <command> <options> <score files>
For a list of available commands, run:
$ bob vuln --help
For more information on a specific command (available options, number of score files needed), you can use the integrated help option available for each command:
$ bob vuln metrics --help
Metrics
The metrics command generates a list of useful metrics (FMR, FNMR, IAPMR, etc.) for
a specific operating point (threshold value).
It is possible to specify a value for the threshold, or a criterion can be used to compute this value automatically by minimizing an error rate.
This command is useful to get a quick evaluation of a system on a single operating point.
Example:
$ bob vuln metrics --eval results/scores-{dev,eval}.csv
Output:
[Min. criterion: EER ] Threshold on Development set `results/scores-dev.csv`: -4.150729e-01
==============================  ==================  =================
..                              Development         Evaluation
==============================  ==================  =================
Licit Failure to Acquire        0.0%                0.4%
Licit False Match Rate          0.1% (30/24000)     0.0% (0/12056)
Licit False Non Match Rate      0.1% (2/1600)       0.2% (2/1096)
Licit False Accept Rate         0.1%                0.0%
Licit False Reject Rate         0.2%                0.6%
Licit Half Total Error Rate     0.1%                0.1%
Attack Presentation Match Rate  100.0% (2548/2549)  99.9% (1901/1902)
==============================  ==================  =================
Histograms
The hist command plots the different distributions (positives, negatives,
as well as spoof) of the scores, allowing to visualize if a biometric system can
distinguish impostors and attacks from genuine samples.
The threshold value for EER can be displayed. When using a development and evaluation set, the threshold value is computed only on the dev set and reported to the eval graph.
Example:
$ bob vuln hist --eval results/scores-{dev,eval}.csv --output results/hist.pdf --figsize "6,5"
Output:
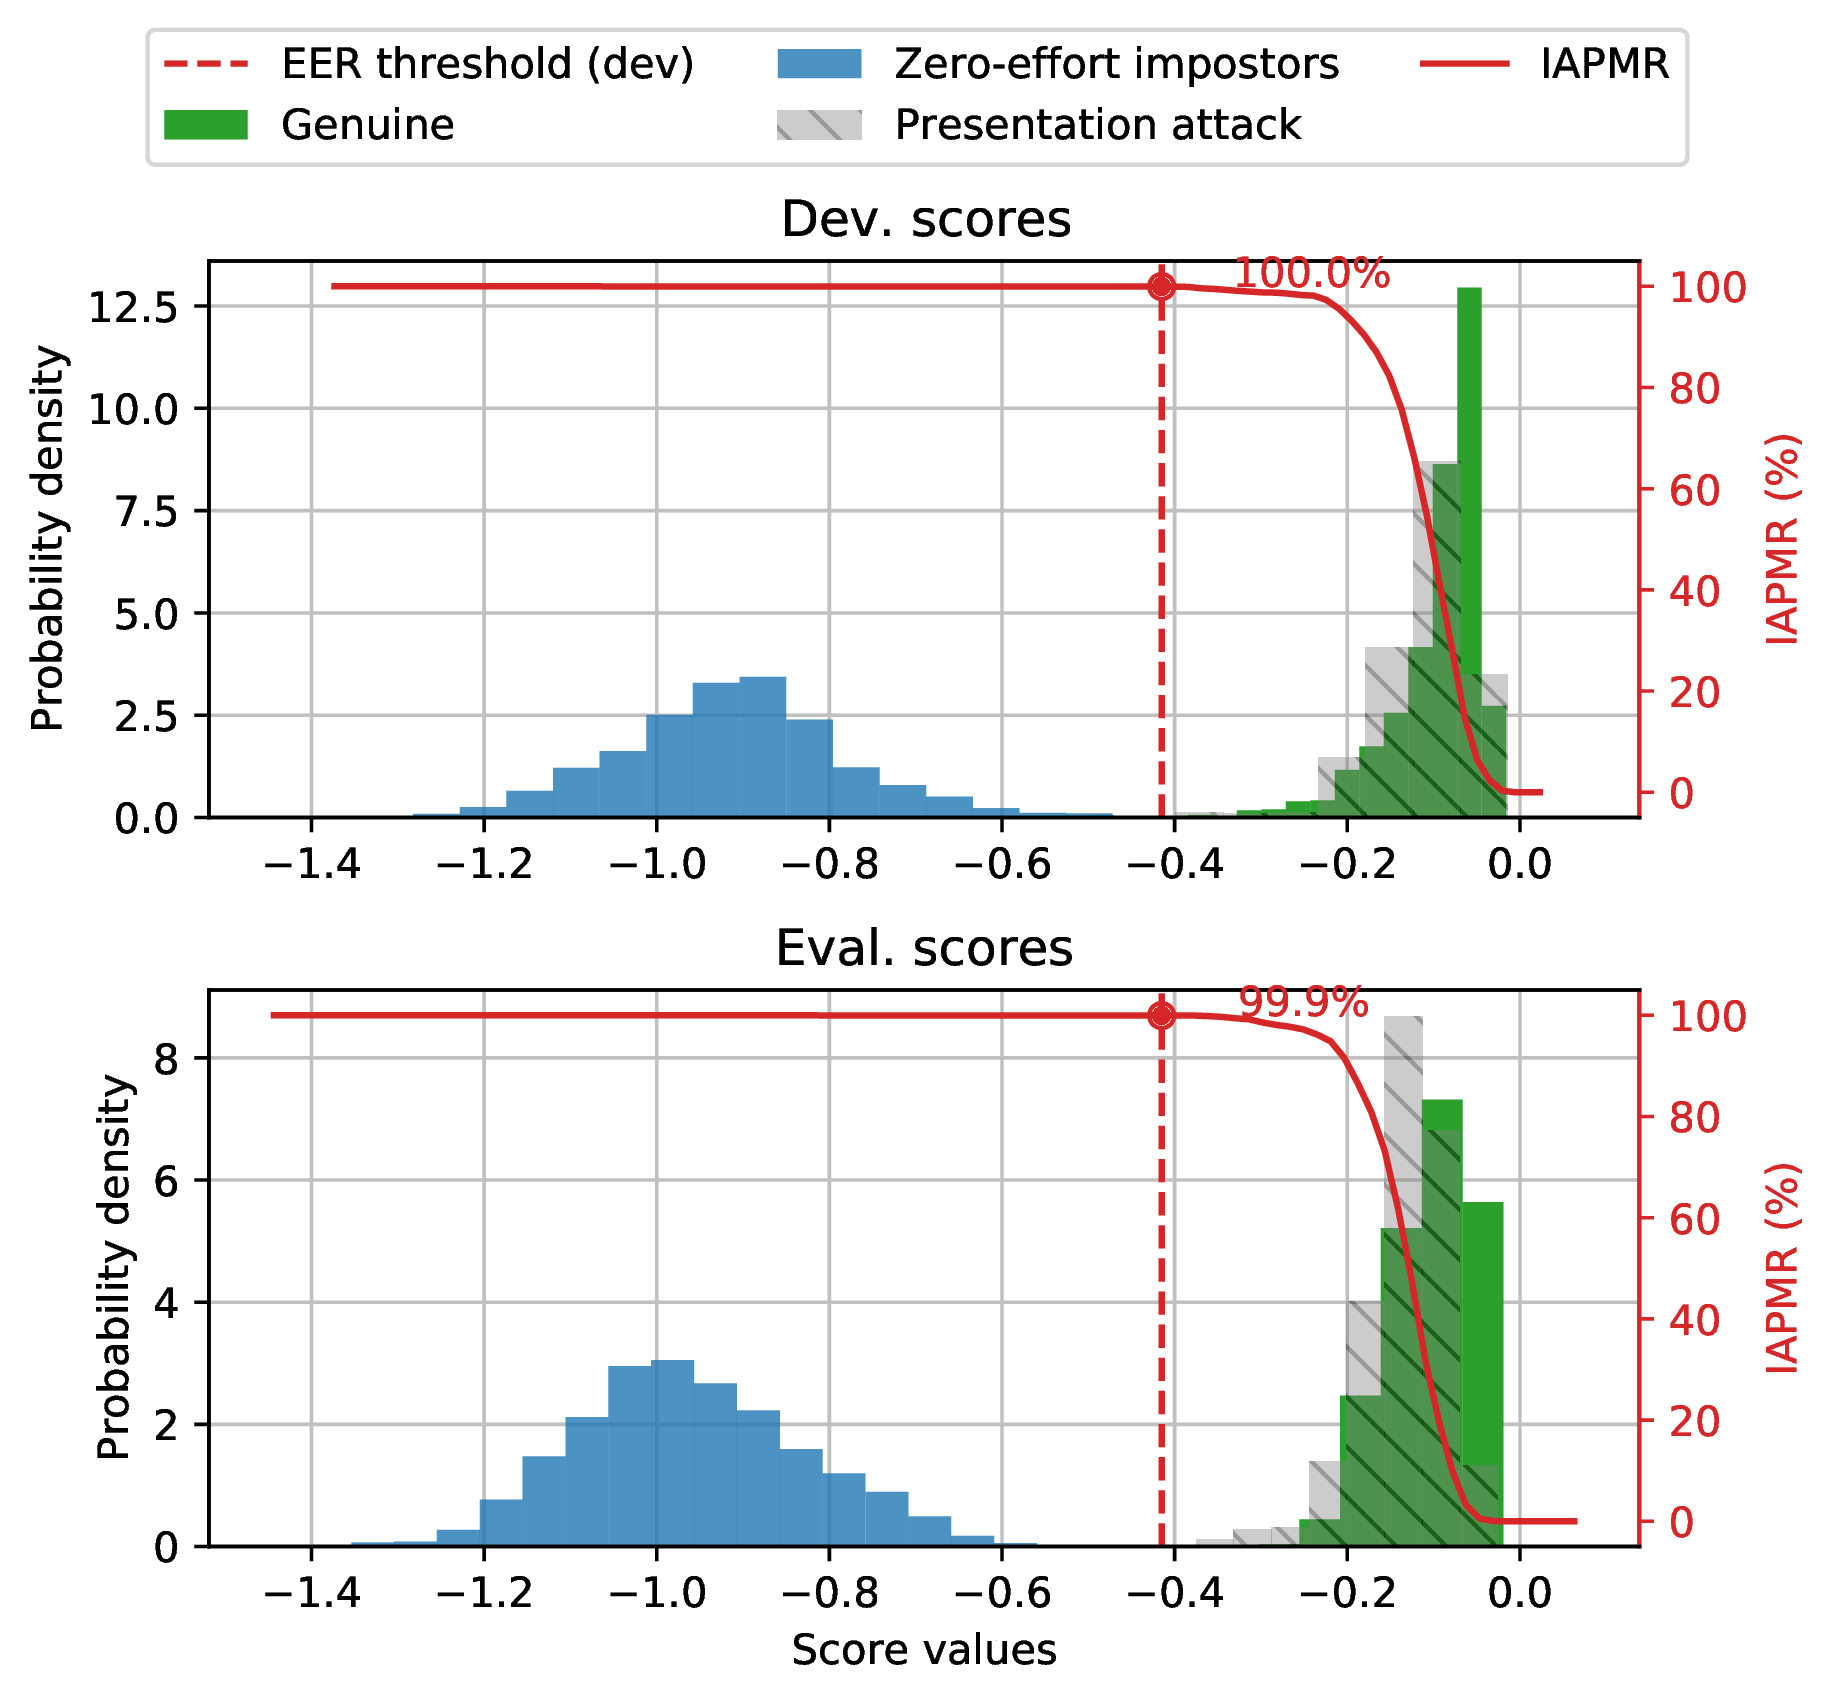
Fig. 12 Histogram of genuine, zero-effort impostor, and attack impostor scores.
ROC and DET
The roc and det commands plot the FMR against the FNMR of a system
allowing for example to assess the resulting FMR for a wanted minimum FNMR
value.
For vulnerability, the IAPMR is also plotted against the FNMR.
Example:
$ bob vuln roc --eval results/scores-{dev,eval}.csv --output results/roc.pdf --figsize "6,4"
Output:
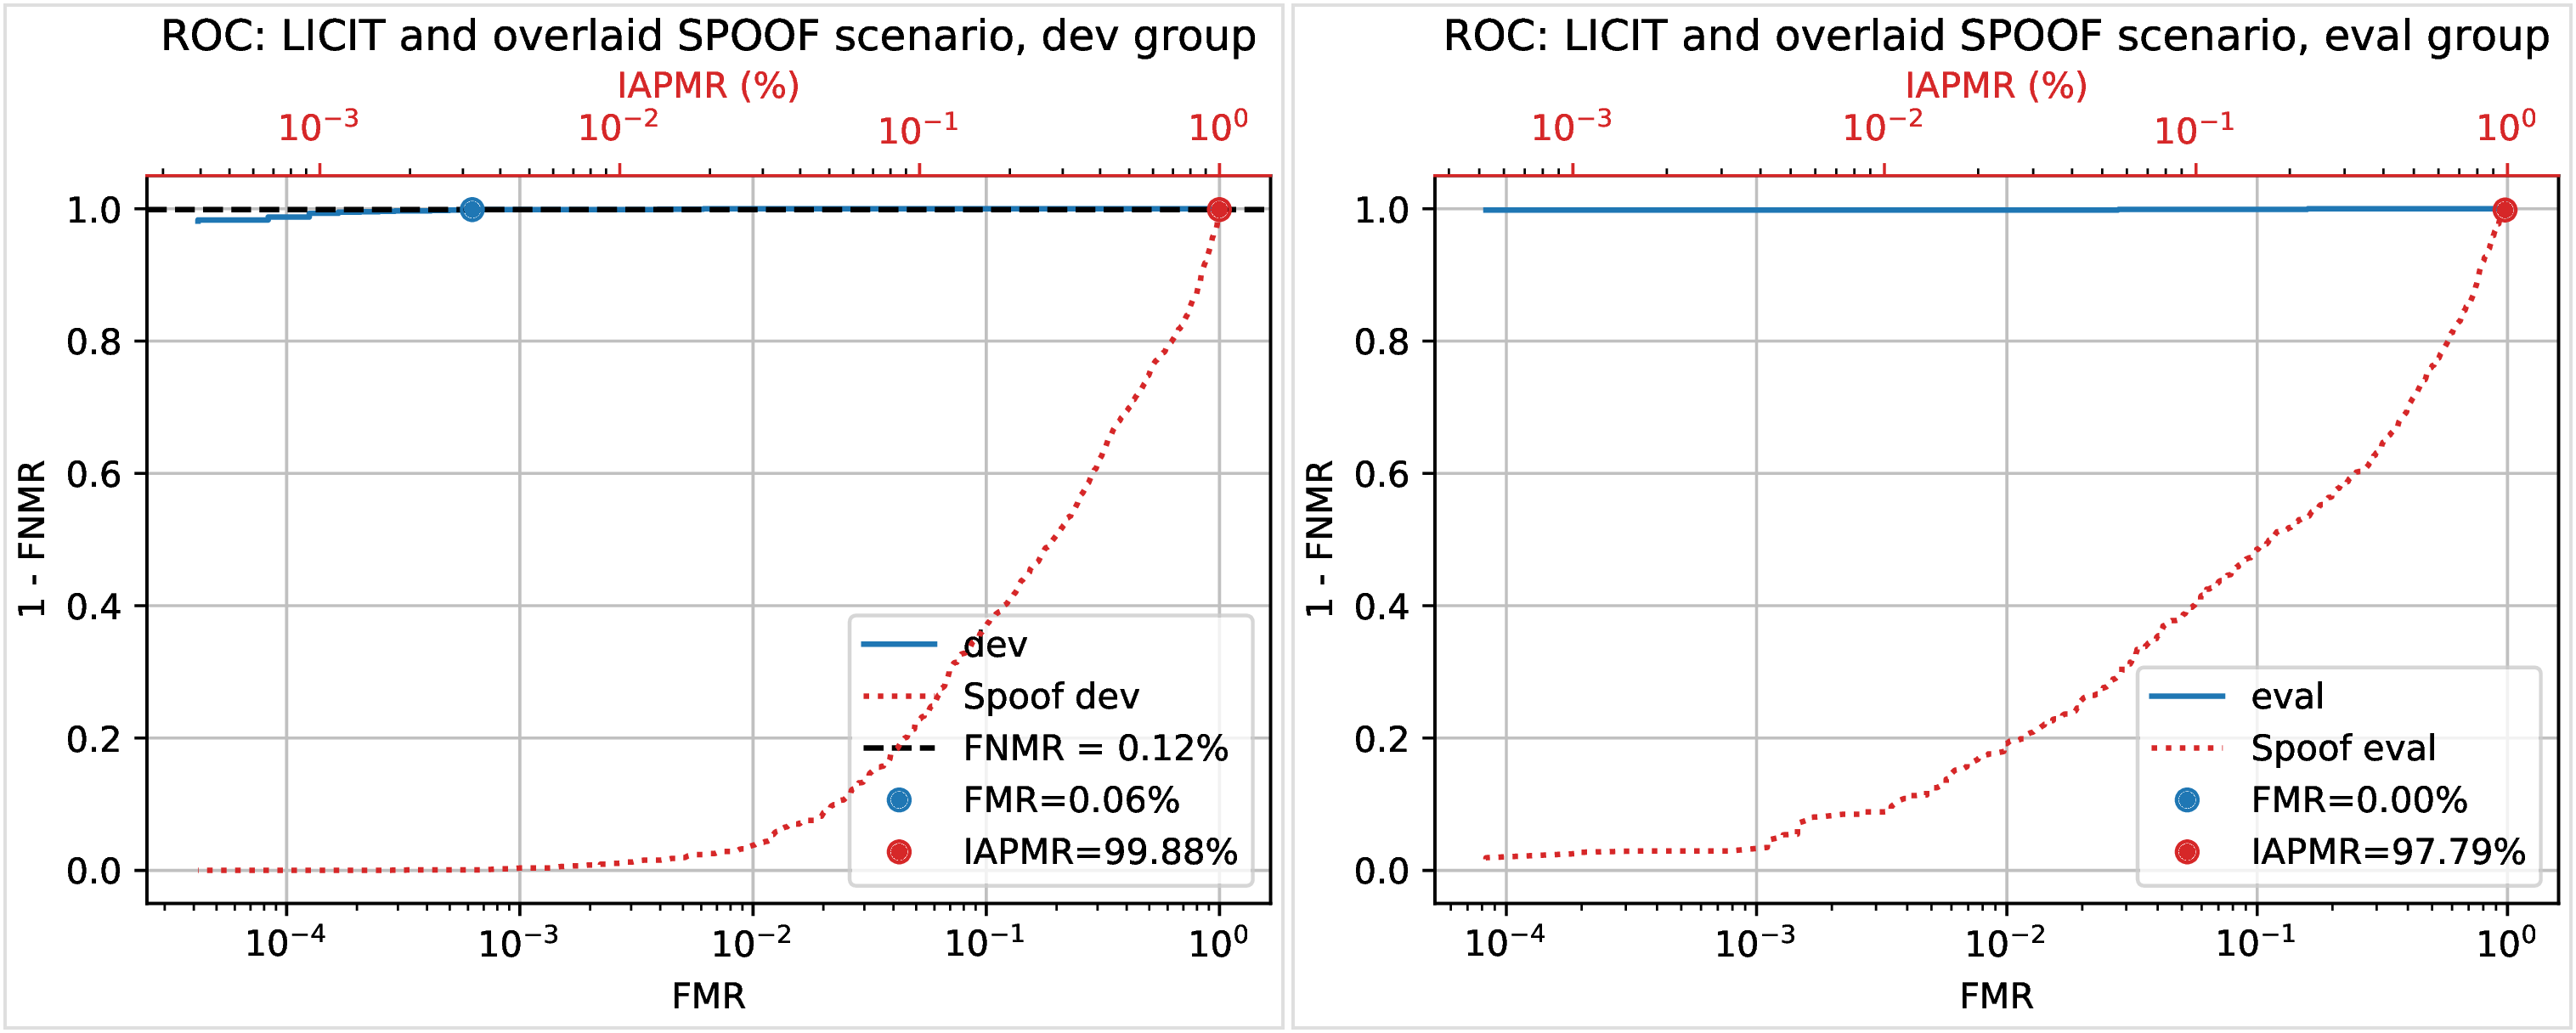
Fig. 13 ROC of dev and eval groups. The annotated threshold value is chosen on dev.
IAPMR vs FMR
The fmr-iapmr command plots the IAPMR against the FMR, allowing to see the
ratio of accepted attacks given an FMR value.
Example:
$ bob vuln fmr-iapmr results/scores-{dev,eval}.csv --output results/fmr_iapmr.pdf --legends "replay-mobile"
Output:
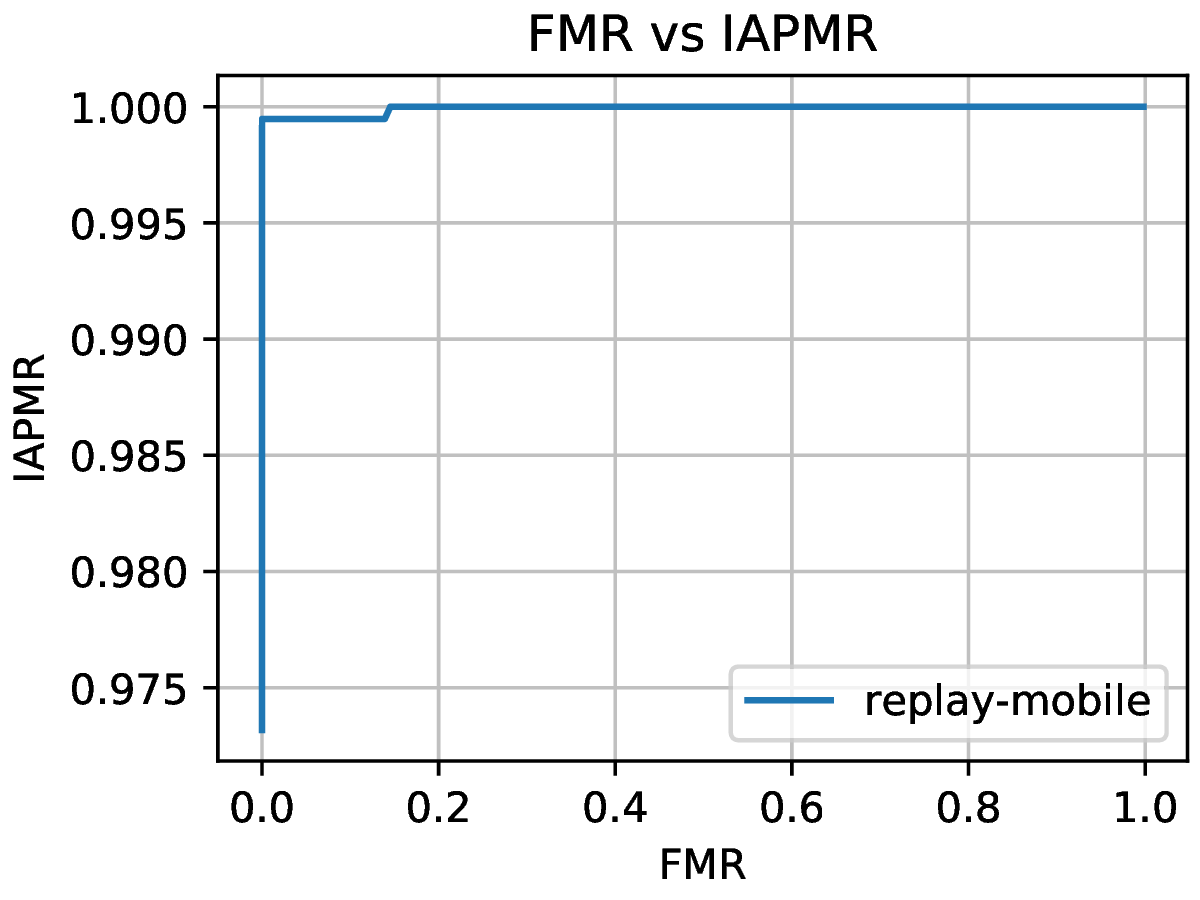
Fig. 14 Plot of the IAPMR vs the FMR for various threshold values.
EPSC
The epsc command plots the WER and IAPMR for different values of \(\beta\) and
\(\omega\) parameters used to compute this error rate.
Since two variables are in play, one of them can be set and the other plotted, or a three-dimensional plot can be drawn.
It is also possible to only draw the WER or the IAPMR plot.
Example:
$ bob vuln epsc results/scores-{dev,eval}.csv --output results/epsc.pdf --fixed-params "0.5,0.6" --figsize "8,4"
Output:
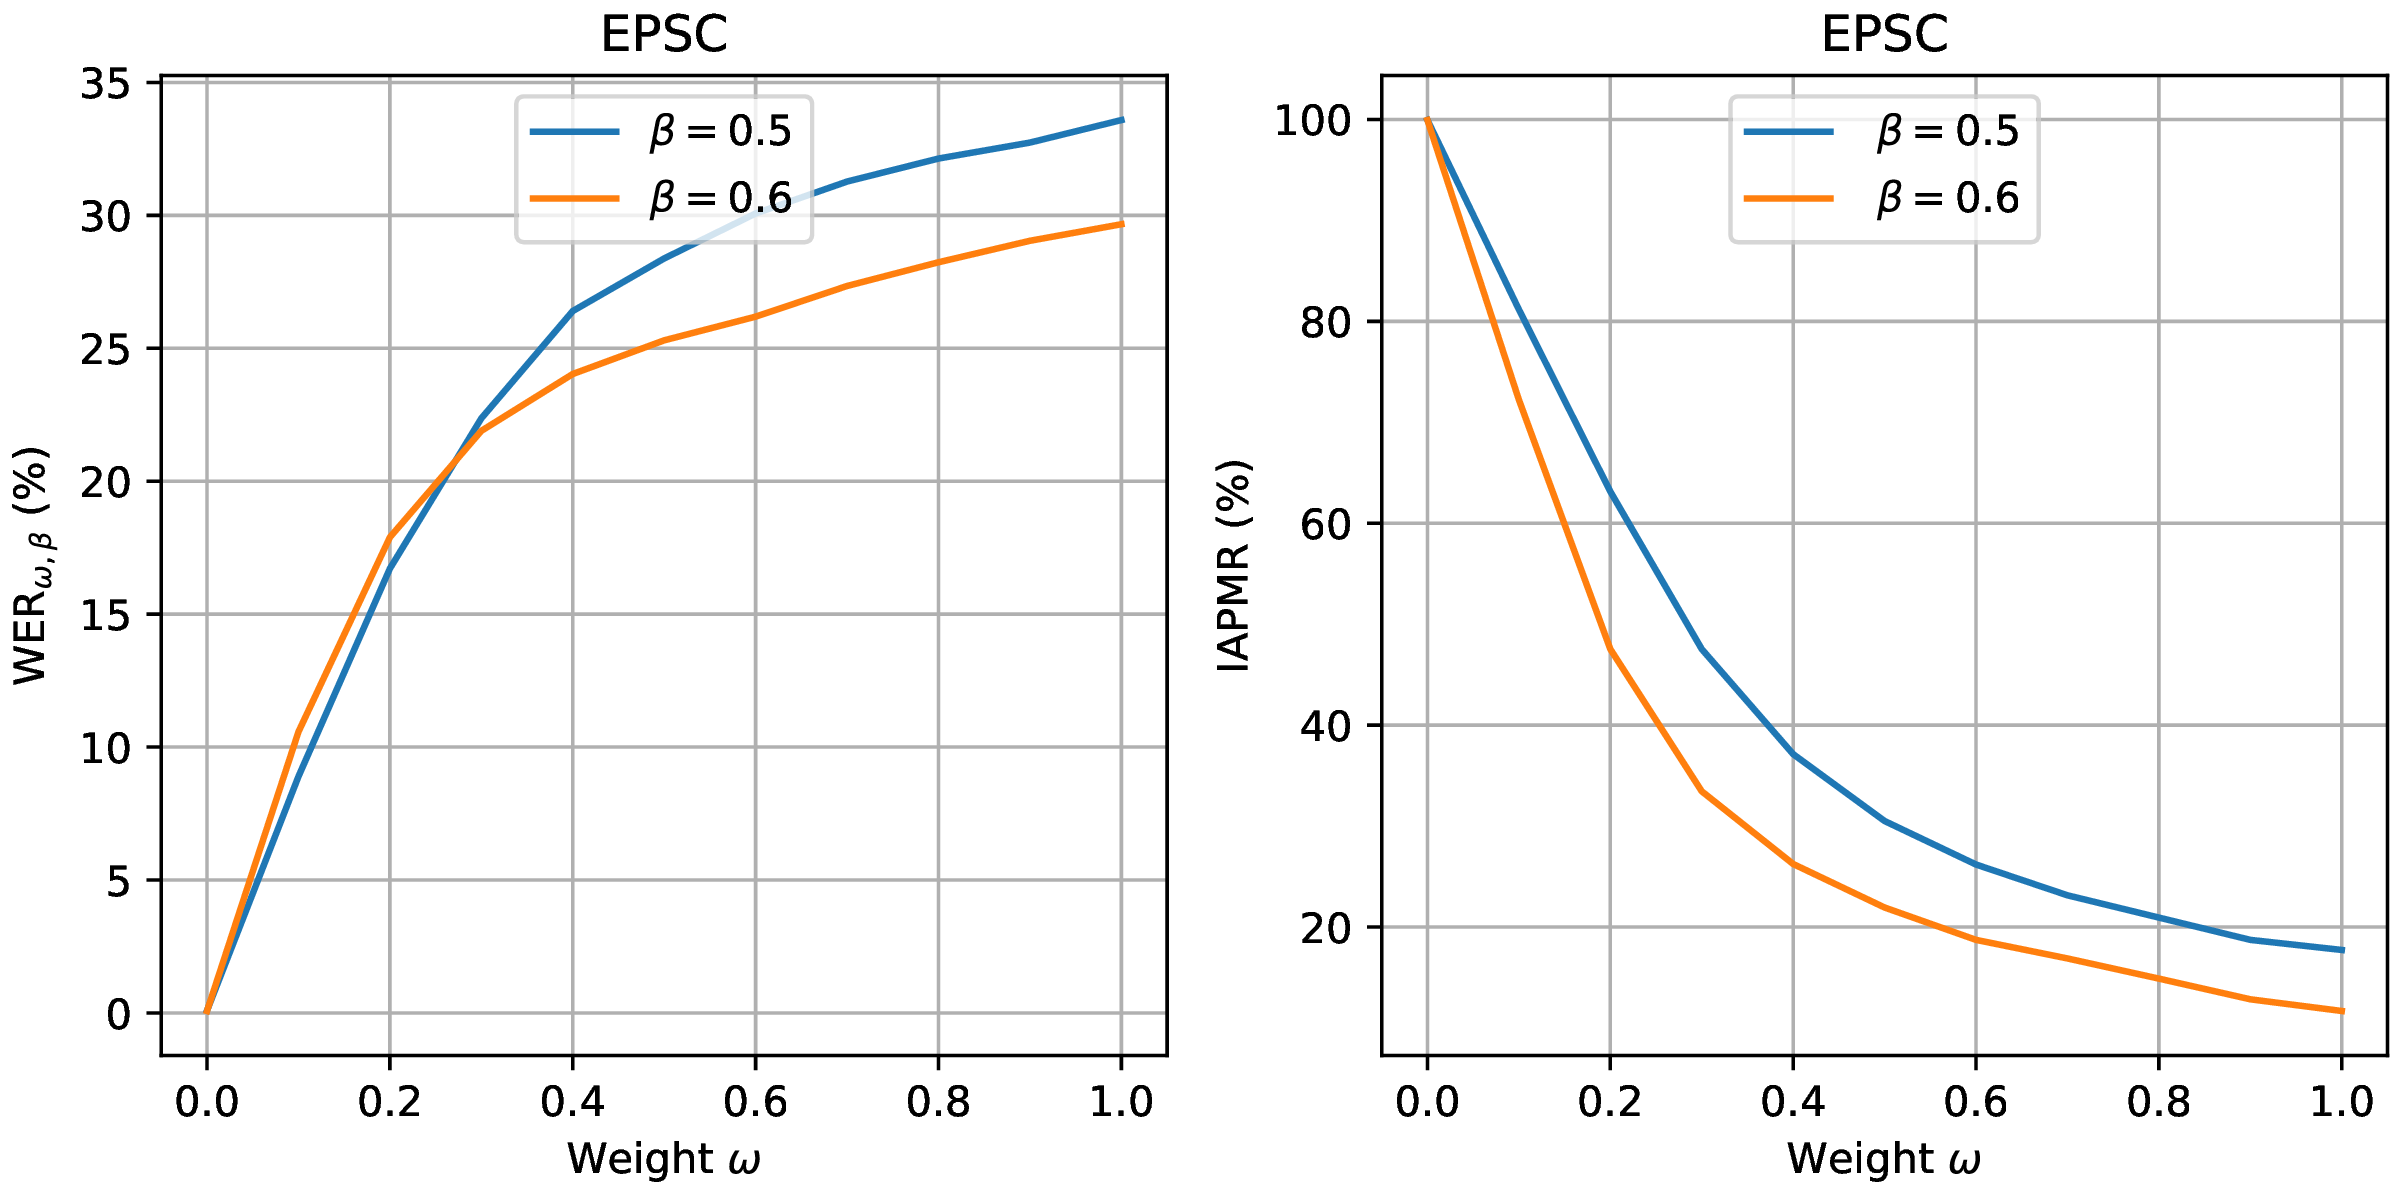
Fig. 15 EPSC with \(\omega\) varying and \(\beta\) set at 0.5 and 0.6.
EPC
The epc command plots the EPC of the system with the IAPMR overlaid on top.
Example:
$ bob vuln epc results/scores-{dev,eval}.csv --output results/epc.pdf
Output:
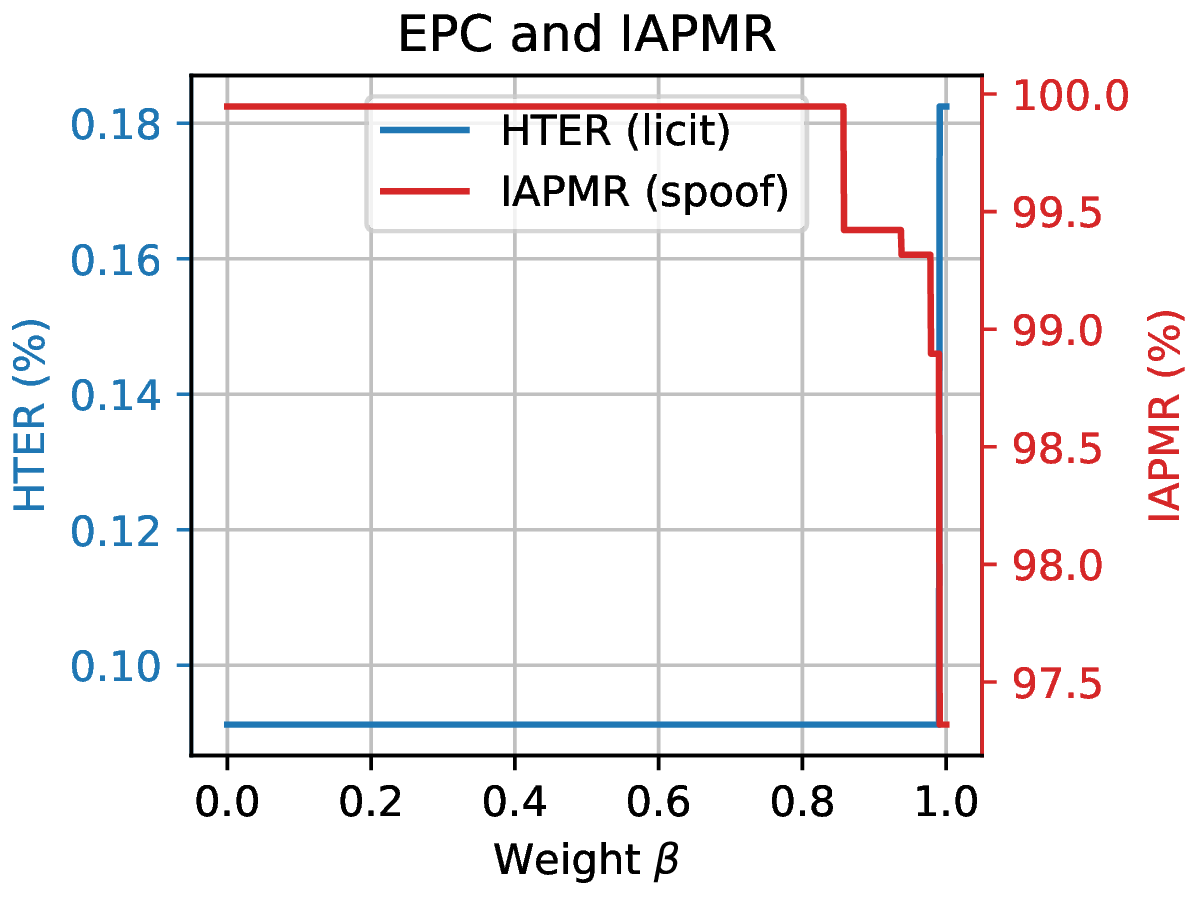
Fig. 16 EPC of the system with the corresponding IAPMR curve.
Evaluate
The evaluate command creates a single report with multiple plots to display
different aspects of the evaluation.
Example:
$ bob vuln evaluate results/scores-{dev,eval}.csv --output results/report.pdf
References
- Chingovska_SPRINGER_2019
Chingovska, Ivana and Mohammadi, Amir and Anjos, André and Marcel, Sébastien Evaluation methodologies for biometric presentation attack detection, 2019, Springer